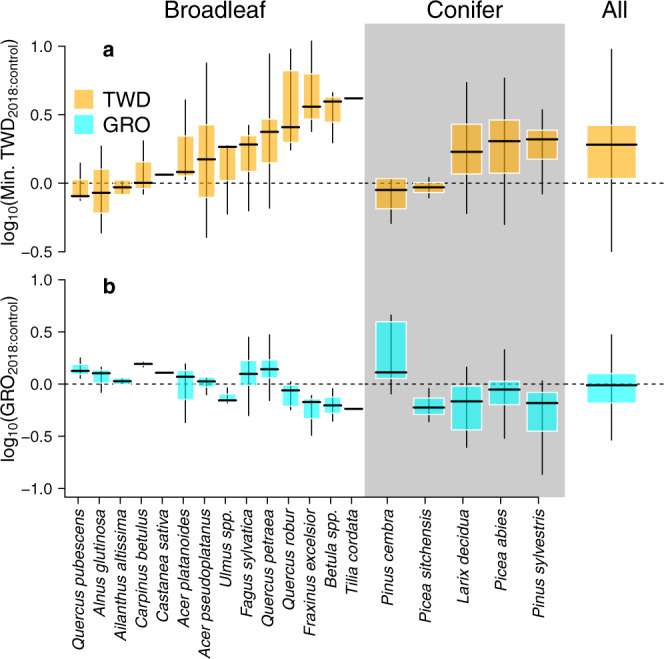
Fig. 2. Species-specific ratios of tree water deficit (TWD) during the 2018 heatwave and 2018 annual growth (GRO) relative to control years (2016–2017).

a, b Boxplots of broadleaf and conifer minimum tree water deficit (min. TWD2018:control; a) and annual radial stem growth (GRO2018:control; b) in response to the 2018 heatwave relative to control years. Log transformed ratios are shown to linearise and normalise the response metric. log10(TWD2018:control) above zero indicates a larger shrinkage was registered during the 2018 heatwave compared to the control years, whereas log10(GRO2018:control) near zero indicates that stem growth in 2018 was similar to that in control years. Centerlines, box limits, and whiskers represent the median, upper and lower quartiles, and extremes excluding outliers (those further than the 1.5x interquartile range). n = 175 tree stems over 37 sites.
