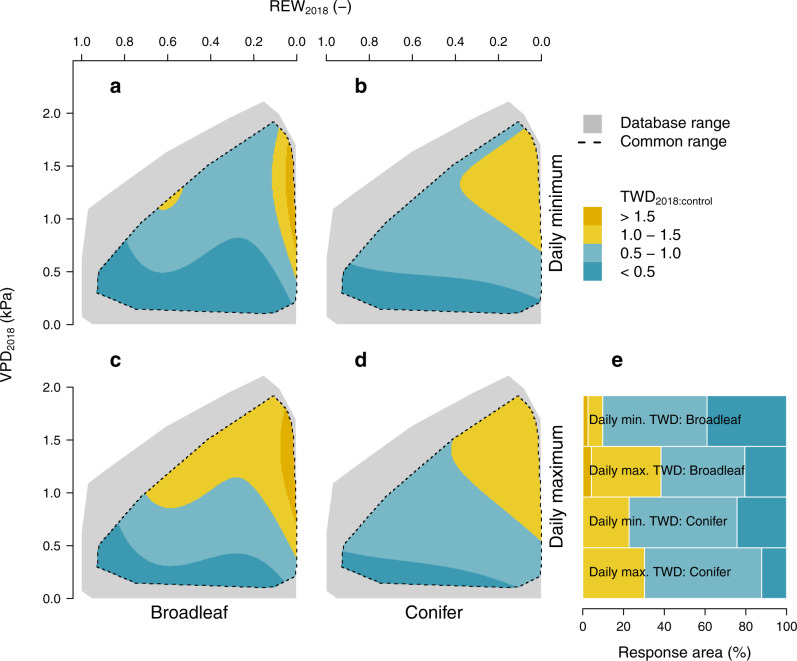
Fig. 3. Response of tree water deficit (TWD) ratio to vapor pressure deficit (VPD, kPa) and relative extractable water (REW, unitless [-]) of broadleaf (a, c) and conifer (b, d) species in the hydrometeorological space.
a–d Linear-mixed effect model output of the ratio of the daily minimum (a, b) and maximum (c, d) TWD during the 2018 heatwave compared to the 95th percentile of the control period (TWD2018:control), while VPD2018 and REW2018 refer to the absolute values during the 2018 heatwave. TWD2018:control above 1 indicates that a larger shrinkage was registered during the 2018 heatwave relative to the control period. From the hydrometeorological space range of the entire database (indicated in grey), models have been adjusted for the common climatic range of broadleaf and conifer species only (indicated with dotted lines). e Bars indicate the percentage of the hydrometeorological space covering different ranges of TWD2018:control values (see legend).

