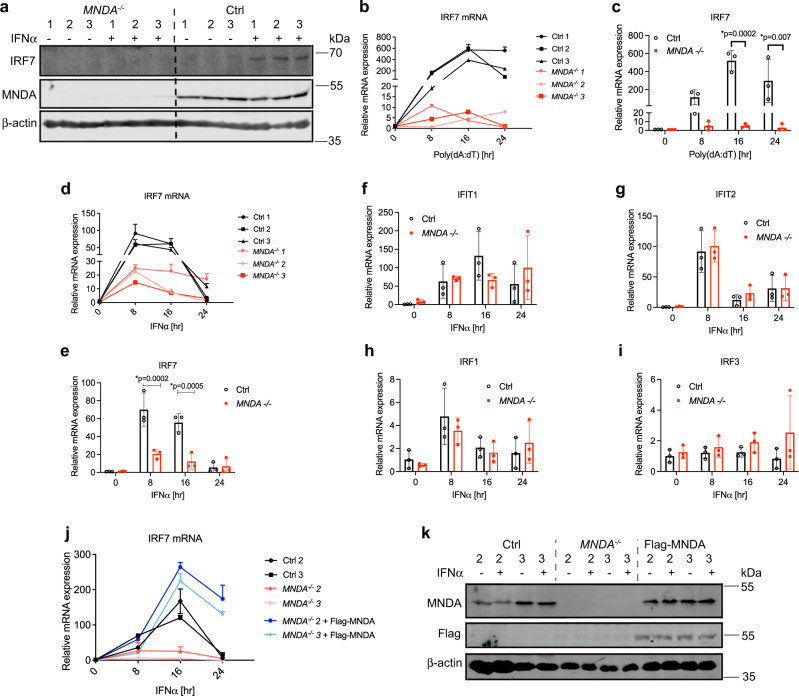
Fig. 4. Genetic ablation of MNDA impairs IRF7 mRNA induction.
a Immunoblot analysis of IRF7 and MNDA protein expression in three MNDA−/− or three control THP-1 clones. b–e Three clones of MNDA−/− or control (Ctrl) THP-1 cells were transfected with 2.5 μg/ml poly(dA:dT) (b, c) or treated with 1000 U/ml IFNα (d, e) or for the indicated times. Quantitative PCR analysis of IRF7 mRNA shown for individual clones (b, d) or mean of all clones (c, e). f–i Quantitative PCR analysis of mRNA expression of IFIT1 (f), IFIT2 (g), IRF1 (h) or IRF3 (i) in MNDA−/− or control THP-1 cells. Data shown is mean of three clones. j, k Flag-MNDA was reconstituted into MNDA−/− clone 2 and 3 by lentiviral transduction. Control cells (Ctrl), MNDA−/− cells expressing empty lentiviral vector or vector encoding Flag-MNDA were stimulated with IFNα (1000 U/ml) for the indicated times. j Quantitative PCR analysis of IRF7 mRNA. k Immunoblot analysis of Flag MNDA and MNDA protein after 24 h IFNα stimulation. All data are mean ± SD of triplicate samples and are representative of three independent experiments; two tailed unpaired Students t test; *p < 0.05 indicates significance compared to respective groups. Immunoblots (a, k) are representative of three experiments.

