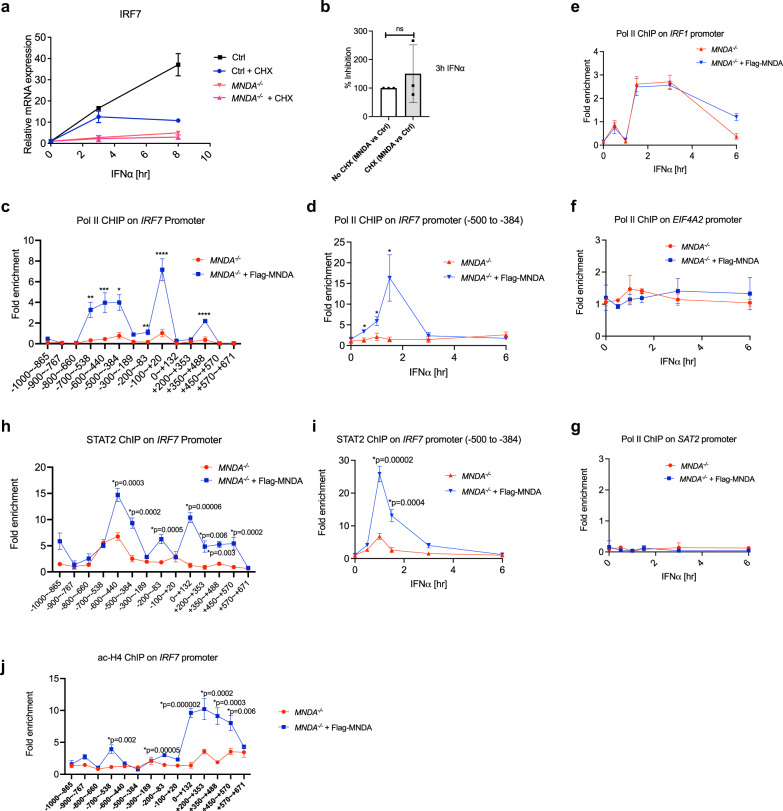
Fig. 6. IFNα-dependent Pol II and STAT2 recruitment to the IRF7 promoter is MNDA-dependent.
a, b Three THP-1 MNDA−/− or control (Ctrl) clones were pre-treated for 1 h with cycloheximide (CHX) as indicated followed by IFNα (1000 U/ml) stimulation for the indicated times. Quantitative PCR analysis of IRF7 mRNA is shown for the average of three cell lines (a) and as percentage of inhibition of IRF7 mRNA seen in the MNDA−/− cells versus control cells, setting the amount of inhibition in the absence of CHX as 100% (b). For (a, b), data are mean ± SD of triplicate samples and are representative of three independent experiments; two tailed unpaired Students t test; significance is defined as p < 0.05 between groups; ns indicates not significant (c) Chromatin immunoprecipitation (ChIP) of the recruitment of RNA Pol II to the IRF7 promoter between the region of nucleotides −1000 to +671, using primer sets to amplify the specific regions indicated in MNDA−/− cells expressing empty lentiviral vector or vector encoding Flag-MNDA. Cells were stimulated with IFNα (1000 U/ml) for 1 hr. d–g Cells were treated with IFNα (1000 U/ml) for the indicated times prior to ChIP analysis. ChIP of the recruitment of RNA Pol II to the −500 to −384 region of the IRF7 promoter (d), the IRF1 promoter (e), the EIF4A2 promoter (f) and the SAT2 promoter (g) in MNDA−/− cells expressing empty lentiviral vector or vector encoding Flag-MNDA. h ChIP of the recruitment of STAT2 to the IRF7 promoter between the region of nucleotides −1000 to +671, using primer sets as per (c). Cells were stimulated with IFNα (1000 U/ml) for 1 hr. i ChIP of the recruitment of STAT2 to the −500 to −384 region of the IRF7 promoter. Cells were treated with IFNα (1000 U/ml) for the indicated times. j ChIP of the recruitment of Histone H4K5,8,12,16ac (ac-H4) to the IRF7 promoter between the region of nucleotides −1000 to +671, using primer sets as per (c). Cells were stimulated with IFNα (1000 U/ml) for 1 hr. For (c–j), data are presented as mean ± SEM of three independent experiments, each done with technical duplicates; two tailed unpaired Students t test; *p < 0.05 indicates significance compared to respective groups; p values for (c) are *p = 0.02, **p = 0.003, ***p = 0.004, ****p = 0.0002; for (d) are *p = 0.02. ChIP antibody isotype controls for (c–e, h–j) are shown in Supplementary Fig. 9.

