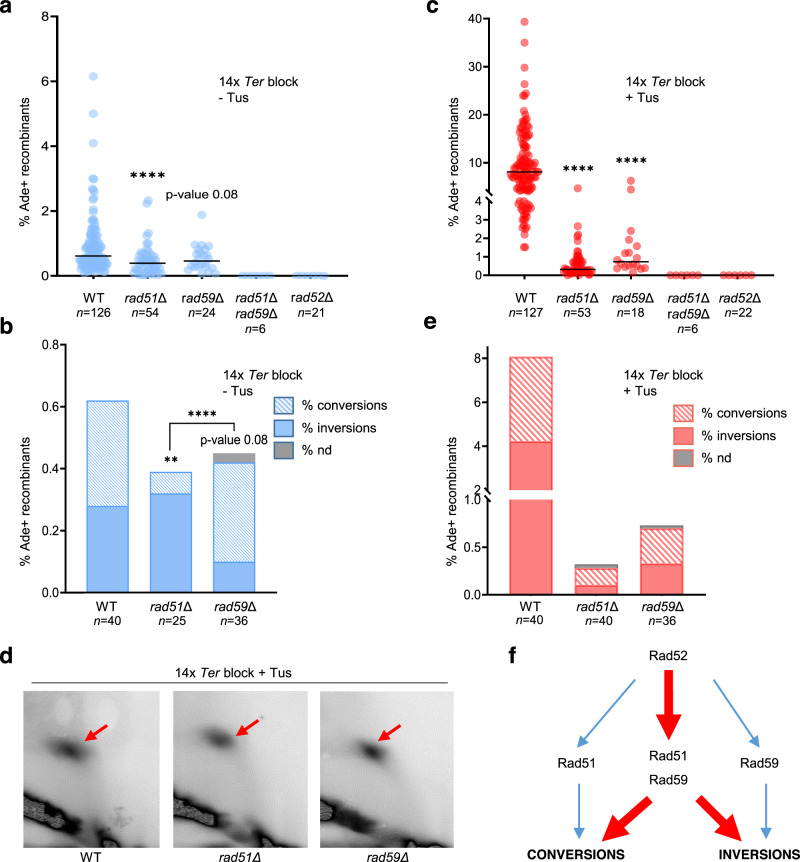
Fig. 2. NAHR at the Tus/Ter barrier relies on the cooperation of Rad51 and Rad59.
a Spontaneous Ade+ recombination frequencies in WT and mutant strains. Black lines indicate medians; n indicates the number of colonies tested. p-values were obtained on log-transformed data by one-way ANOVA with a Bonferroni post-test and are relative to the WT strain in the same condition. They are reported as stars when significant with: ****p-value < 0.0001. Exact p-values are reported in Supplementary Data 1. b Distribution of independent spontaneous recombination events scored by PCR; nd indicates structure could not be determined by PCR; n indicates the number of independent Ade+ recombinants tested. p-values, reported as stars when significant, were obtained by Chi-square test: **p-value < 0.005, ****p-value < 0.0001. Exact p-values are reported in Supplementary Data 1. c Tus-induced Ade+ recombination frequencies in WT and mutant strains. Black lines indicate medians; n indicates the number of colonies tested. P-values were obtained on log-transformed data by one-way ANOVA with a Bonferroni post-test and are relative to the WT strain in the same condition. They are reported as stars when significant with ****p-value < 0.0001. d 2D gel analysis of replication intermediates showing similar fork arrest in the WT and mutant strains. Red arrows indicate the replication fork arrest on the arc of Y-shaped replication intermediates. e Distribution of events scored by PCR for Tus-induced recombinants. n indicates the number of independent Ade+ recombinants tested. Data were analyzed by Chi-square test. Source data are provided as a Source Data file. f Contribution of Rad51, Rad52, and Rad59 to spontaneous (blue) and replication fork block-induced (red) NAHR pathways.

