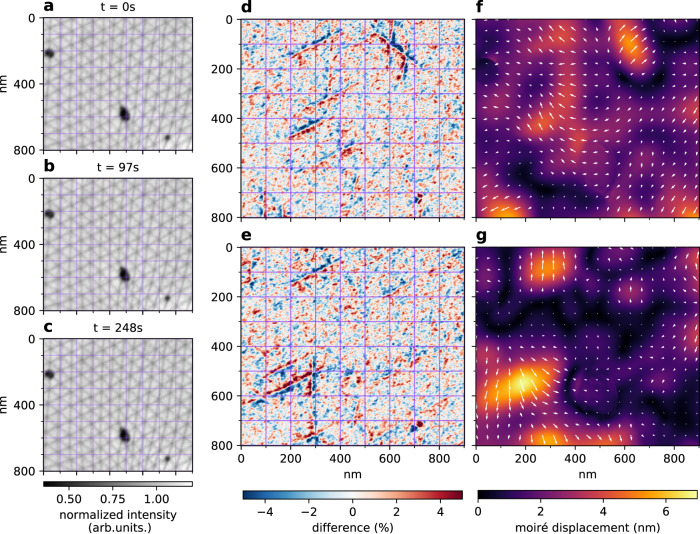
Fig. 4. Dynamics of moiré patterns.
a–c Three images of the same area (in the same domain as Fig. 1f), taken minutes apart at a constant temperature of 500 °C. Here, θ* ≈ 0.18 and ϵ ≈ 0.04% (local values as extracted by GPA shown in Supplementary Fig. 4). d, e Difference of respectively b and c with a, i.e., t = 0 s, highlighting the shift of the domain boundaries. f, g GPA extracted displacement of respectively b and c with respect to t = 0 s, with the arrows indicating the direction and amplitude, magnified eight times for visibility.

