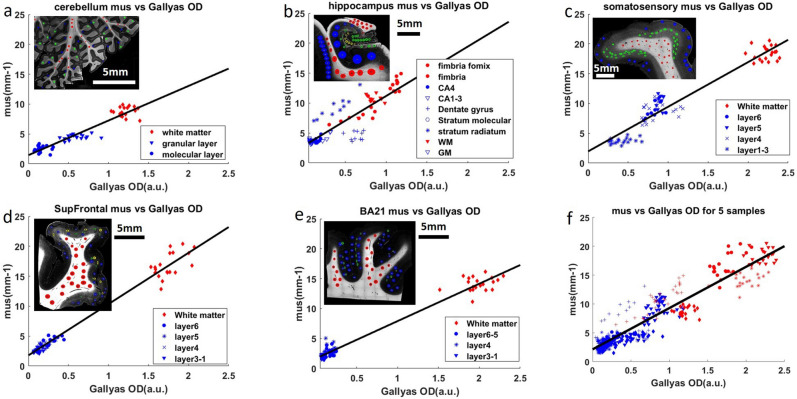
Figure 2.
(a–e) Linear regression of and Gallyas OD for 5 different regions in human brain samples. Red dots: white matter data points. Blue dots: grey matter data points. The inset figure shows the Gallyas OD map of the corresponding sample. The Red circles in the inset figure represent the ROIs in the white matter. The blue, green and yellow circles represent the ROIs in different layers of the grey matter, for example, the green ROIs in (c) represent infragranular layers and the blue ROIs represent the supragranular layers. (a) Cerebellum, (b) hippocampus, (c) somatosensory cortex, (d) superior frontal cortex (SupFrontal), (e) middle temporal Brodmann area 21(BA21), (f) linear regression of all data points from 5 samples. The six panels have the same range on the X and Y axes for easier comparison.

