Figure 1.
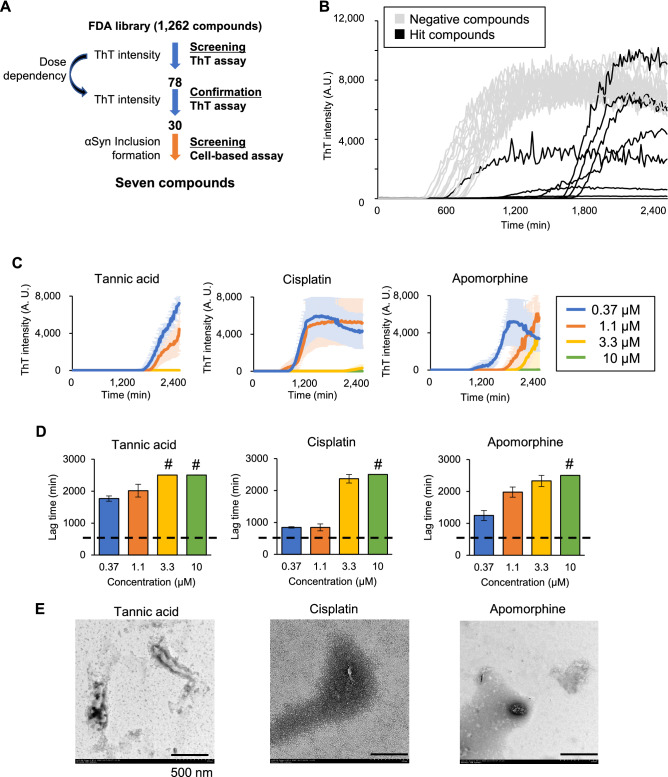
ThT fluorescence assay used for the screening of αSyn fibrillation inhibitors. (A) Schematic illustration of the two-step screening. (B) ThT kinetics of the wells with representative positive hits (black lines) and negative compounds (gray lines). (C) ThT kinetics of the top 3 hit compounds at different concentrations. Data are shown as the mean ± SEM of three independent wells (n = 3). Concentrations of the drugs are as indicated in the right box. (D) Representative lag times of the top 3 hit compounds at different concentrations. Dashed line represents the average lag times in the absence of any compound. Sharp marks (#) indicate that the reaction was stopped since it reached to the maximum duration (2505 min). Data are shown as the mean ± SEM of three independent wells (n = 3). (E) TEM visualization of fibrillation reaction products treated with the indicated compounds. Bar scale: 500 nm.

