Figure 3.
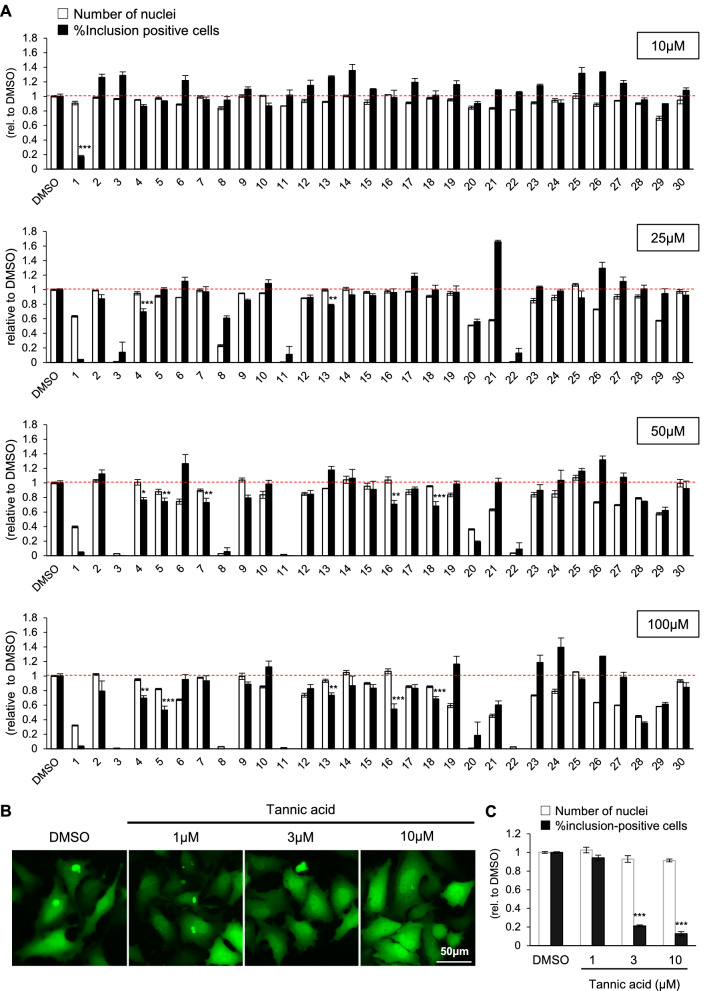
Cell-based screening of αSyn aggregation inhibitors. (A) Quantification of the number of nuclei (white bars) and the percentage of cells containing obvious αSyn-EGFP inclusion bodies (black bars), standardized by those of cells treated with DMSO. Concentration of the drugs are indicated at the right. The numbers under the graph correspond to the numbers in Table 1. Data are shown as the mean ± SEM of three independent wells (n = 3; *P < 0.05; one-way ANOVA with the Dunnett test compared with the DMSO control). (B) Representative images of tannic acid-treated HeLa cells. Cells were transfected with pCMV αSyn-EGFP, followed by treatment with αSyn PFF and the indicated concentrations of tannic acid. (C) Quantification of the number of nuclei (white bars) and the percentage of cells containing obvious αSyn-EGFP inclusion bodies (black bars) in B standardized by those of cells treated with DMSO. Data are shown as the mean ± SEM of three independent wells (n = 3; *P < 0.001; one-way ANOVA with the Dunnett test compared with the no tannic acid control).

