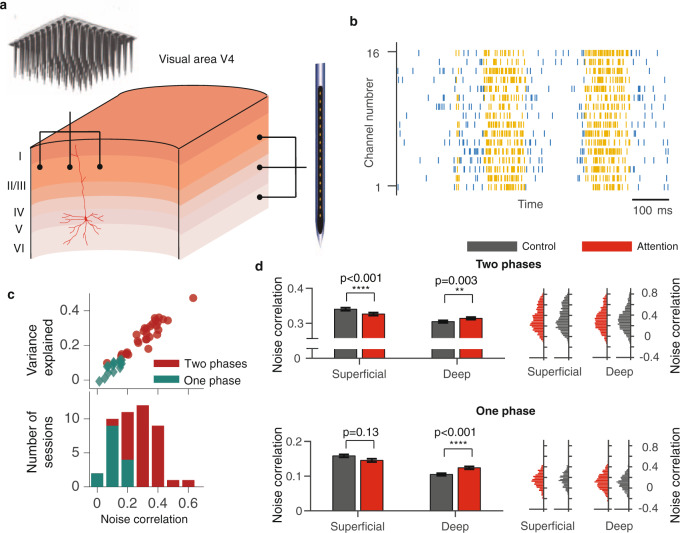
Fig. 1. On-Off dynamics predict the magnitude of noise correlations within cortical columns.
a Different recording techniques sample neurons along different anatomical dimensions. A rectangular Utah multi-electrode array (top) samples from laterally separated neurons in different columns, preferentially from superficial cortical layers. A linear multi-electrode array (right) samples from neurons across all layers within cortical columns. b An example trial showing spontaneous transitions between episodes of vigorous (On) and faint (Off) spiking in multi-unit activity simultaneously recorded from all layers of a cortical column in V4. Spikes (vertical ticks) on 16 recording channels are segmented into On (yellow) and Off (blue) episodes by the HMM. c Scatter plot of the variance explained by the two-phase HMM versus average noise correlation of MU across recording sessions for two-phase (red circles) and one-phase (teal diamonds) recordings (upper panel). Two-phase HMM accounted for a smaller fraction of total variance in one-phase compared to two-phase recordings, because in one-phase recordings, the firing-rate fluctuations were smaller and most of the total variance was due to unpredictable Poisson variability. Stacked histogram of average noise correlations for two-phase (red) and one-phase (teal) recordings (lower panel). d Average noise correlations of MU in two-phase (upper panels) and one-phase (lower panels) recordings, separately for superficial (two-phase: n = 2544 MU pairs for each attention condition; one-phase: n = 920) and deep cortical layers (two-phase: n = 3064 MU pairs for each attention condition; one-phase: n = 1448), in attention (red) and control (gray) conditions (left panels). Histograms show the corresponding distributions of noise correlations in each condition (right panels). Noise correlations slightly decrease in superficial and increase in deep layers, but the overall magnitude of changes is very small. p-values are from two-sided t-test (two-phase: p = 2 × 10⁻⁵ in superficial layers, p = 0.003 in deep layers; one-phase: p = 0.13 in superficial layers, p = 4 × 10⁻⁷ in deep layers). Error bars represent SEM. Source data are provided as a Source Data file.

