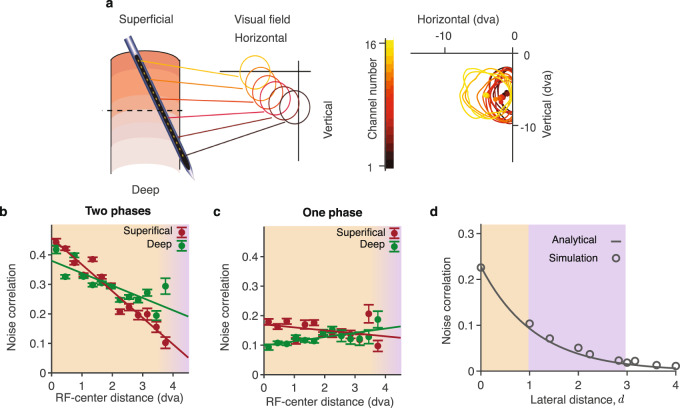
Fig. 4. Dependence of noise correlations on lateral distance.
a Laminar recordings generally exhibit slight horizontal displacements which manifest in a systematic shift of the RFs (circles) across channels (left panel). The shift of the RFs (lines, RF contours; dots, RF centers; dva, degrees of visual angle) for an example recording (right panel). b In two-phase recordings, noise correlations decrease with the RF-center distance in both superficial (crimson) and deep (green) layers (dots - data points, lines - linear regression, superficial layers n = 2544 MU pairs; deep layers n = 3064 MU pairs). Orange background highlights the range of short lateral distances within single or nearby columns. Purple background highlights longer lateral distances between distant columns, such as distances covered by a Utah array, which are outside the range of our laminar recordings. Error bars represent the standard error of the mean (SEM). c Same as b for one-phase recordings. Noise correlations do not decrease with the RF-center distance (superficial layers n = 920 MU pairs; deep layers n = 1448 MU pairs). d Our theory predicts that noise correlations decay with lateral distance exponentially, with the decay constant L called correlation length. Simulations of the full dynamical-system network (circles) agree with the analytical formula derived using the binary-unit network approximation (line). The model parameters α1, α2, ron, and roff are sampled from a distribution of parameters in HMMs fitted to the data. Source data are provided as a Source Data file.

