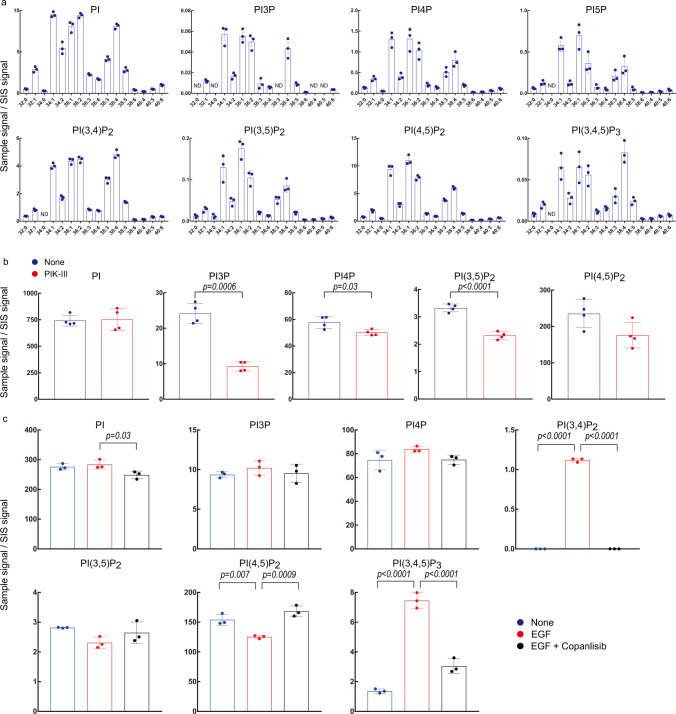
Fig. 2. Application of PRMC-MS to phosphoinositide measurement in cell lines.
a Levels of the indicated phosphoinositide acyl variants in HEK293T cells. PI, PI3P, PI4P, PI(3,5)P2, PI(4,5)P2, and PI(3,4,5)P3 were assessed in mock-transfected cells. PI5P was assessed in cells overexpressing IpgD. PI(3,4)P2 was assessed in non-transfected cells treated with 1 mM H2O2 for 5 min. Data were the mean ± SD (n = 3 biologically independent samples). ND not determined. b Phosphoinositide measurements in HeLa cells treated with vehicle (control) or 5 µM PIK-III for 2 h. PI5P, PI(3,4)P2, and PI(3,4,5)P3 were not detected. Data were the mean ± SD of total acyl variants of the indicated phosphoinositide classes (n = 4 biologically independent samples), and p values by two-sided Welch’s t-test are shown. c Phosphoinositide measurements in PC3 cells that were left untreated (control), or treated with vehicle or 100 nM copanlisib for 30 min prior to stimulation with 10 ng/ml EGF. PI5P was not detected. Data were the mean ± SD of total acyl variants of the indicated phosphoinositide classes (n = 3 biologically independent samples). The significance was analyzed using a two-sided Dunnett’s t-test. Source data are provided as a Source Data file.

