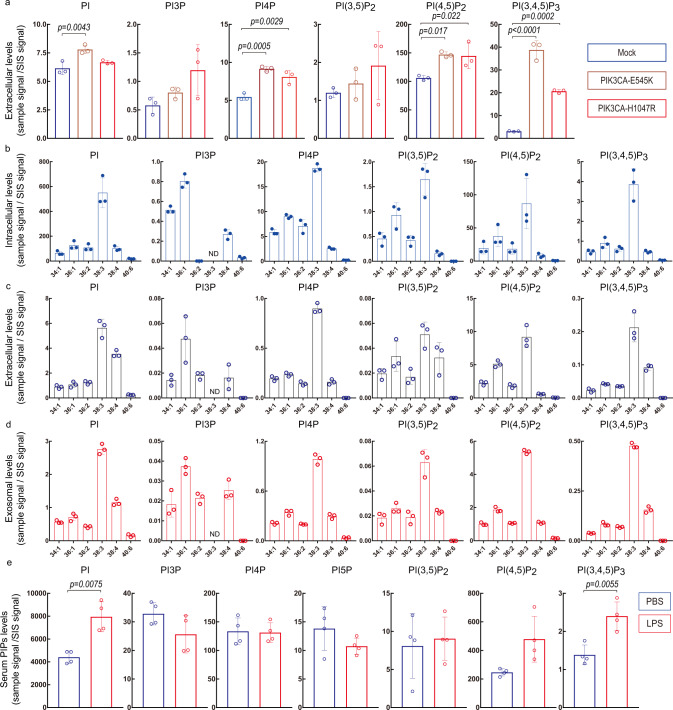
Fig. 4. Application of PRMC-MS to phosphoinositide measurement in liquid samples.
a Quantification of the indicated phosphoinositides in CM of HEK293T cells transfected with either control expression vector (Mock) or vector expressing either mutant E545K or H1047R PIK3CA. CM was collected at 24 h post-transfection. Data were the mean ± SD (n = 3 biologically independent samples) and representative of three independent experiments. Statistical analysis was performed using a two-sided Dunnett’s t-test. b–d Quantification of the indicated phosphoinositide acyl variants in b cell pellets, c CM, and d exosomes derived from LNCap cell cultures. PI5P and PI(3,4)P2 were not detected. Data were the mean ± SD (n = 3 biologically independent samples). e Quantification of the indicated phosphoinositides in plasma from WT mice that were intraperitoneally injected with either vehicle (PBS) or 50 mg/ml lipopolysaccharide (LPS) and analyzed after 2 h. PI(3,4)P2 was not detected in either case. Data were the mean ± SD of total acyl variants of the indicated phosphoinositide classes (n = 4 biologically independent samples). Statistical analysis was performed using two-sided unpaired Welch’s t-test. Source data are provided as a Source Data file.

