Figure 3.
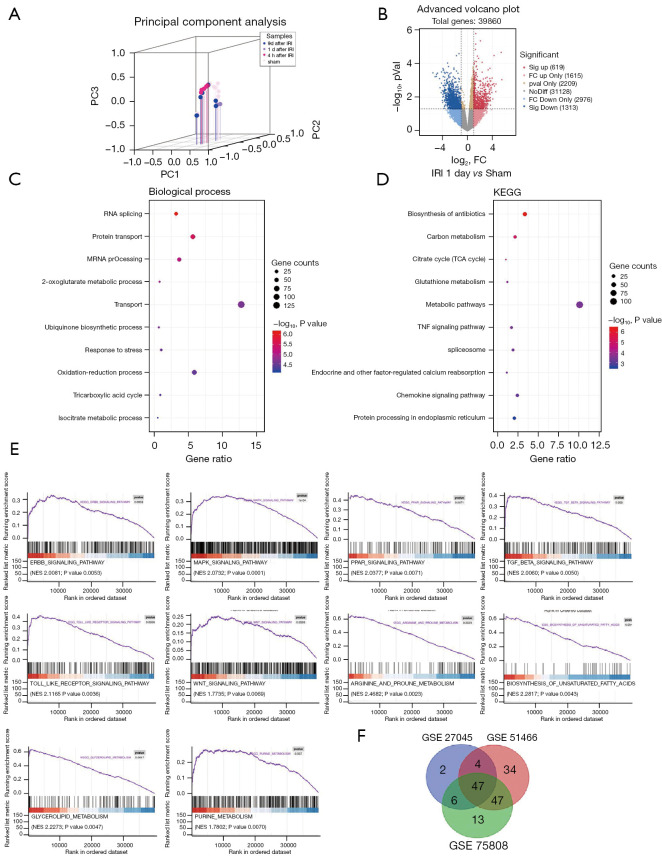
The characteristic and pathways of macrophages involved in murine renal ischemia-reperfusion injury (IRI). (A) Principal component analysis (PCA) plot of the separation between the sham surgery (sham) group, the group of samples taken 4 h postperfusion after IRI (the 4 h group), the group of samples taken 24 h postperfusion after IRI (the 1-day group) and the group of samples taken 9 days postperfusion after IRI (the 9-day group); (B) volcano plot of the differentially expressed genes (DEGs) between the 1-day group and sham group (P<0.05 and |logFC| >1); (C) the enriched biological process terms of the DEGs as identified via Gene Ontology (GO) functional annotation; (D) the enriched Kyoto Encyclopedia of Genes and Genomes (KEGG) pathway terms of the DEGs; (E) gene set enrichment analysis (GSEA) was performed to identify significantly enriched pathways; (F) the Venn diagram represents common and unique pathways that were significantly altered in different datasets.

