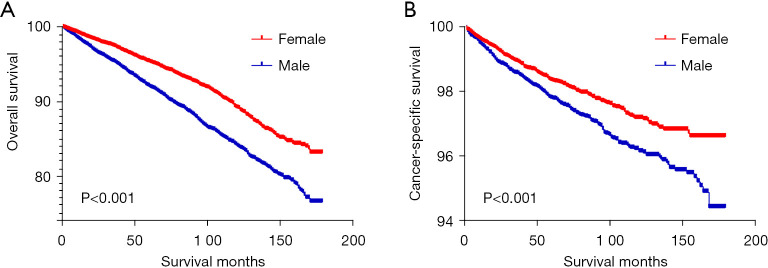
Figure 3.
Kaplan-Meier curves of the post-PSM cohort. All the factors (except for laterality in Table 1) with an impact on the survival prognosis were included in matching. Baseline characteristics were shown in supplementary material. Overall survival (A) and cancer-specific survival (B) curves for female and male patients with thyroid cancer in the post-PSM cohort, log-rank test, P<0.001, respectively.

