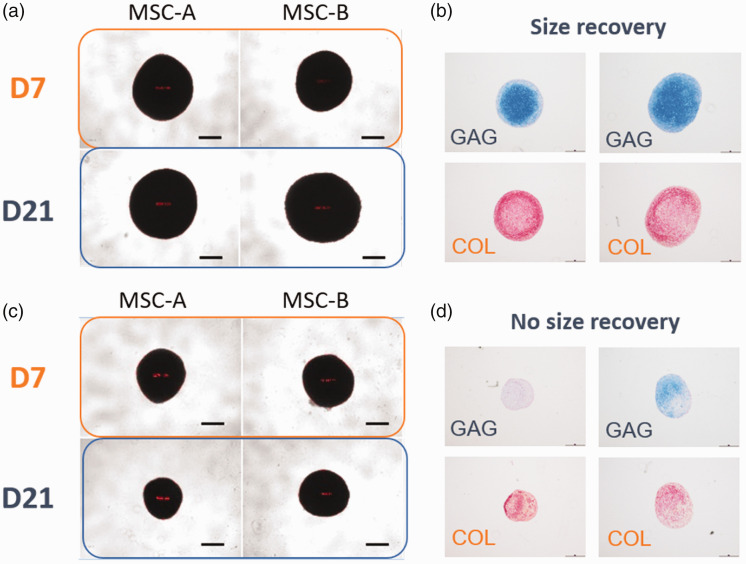
Figure 24.
MSC aggregates in chondrogenic condition. (a) representative images of two MSC lines (MSC-A and MSC-B) at early passage (passage 2 or 3) at day 7 (D7) and day 21 (D21); (b) MSCs at late passage (passage 5) at D7 and D21; (c, d) histology images that were analyzed to confirm the deposition of cartilage-associated extracellular matrices (GAG shown in blue and collagen shown in red). The histology data show that the cells lines recovered in size deposited higher amounts of cartilage-associated extracellular matrices compared to the cell lines did not show the recovery (d).

