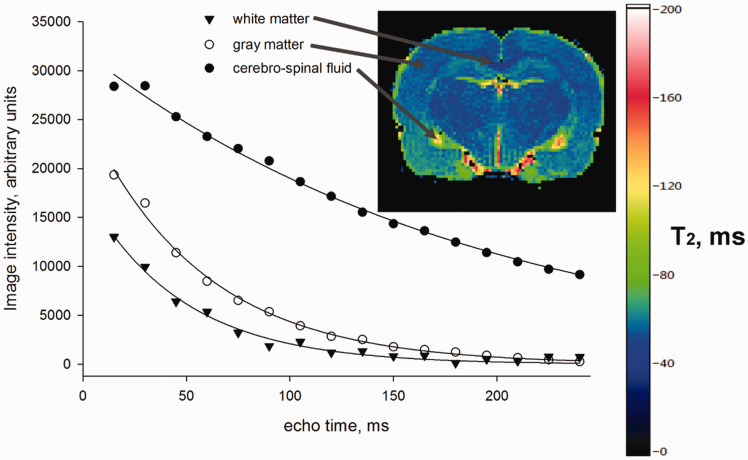
Figure 30.
Representative example of the T2 fitting in the cerebrospinal fluid (●), gray matter (○), and white matter (▼). The image in the top right corner shows the calculated T2 map of the rat brain with the location of the fitted voxels (pointed to using the black lines). Each point in the graph represents the actual image intensity value (in institutional units, y-axis) in the given area of the echo image with the corresponding echo time (x-axis). A total of 16 echo images with 15 ms echo spacing were used. Black curves on the graph show the best fit function using the equation M 5 M0*exp(–TE/T2), where M is the image intensity, M0 is the image intensity of proton density image (at echo time = 0 ms), TE is echo time, and T2 is the sought parameter. The T2 map is color-coded according to the color scale on the right, each voxel in the map representing the observed quantitative T2 relaxation in milliseconds.

