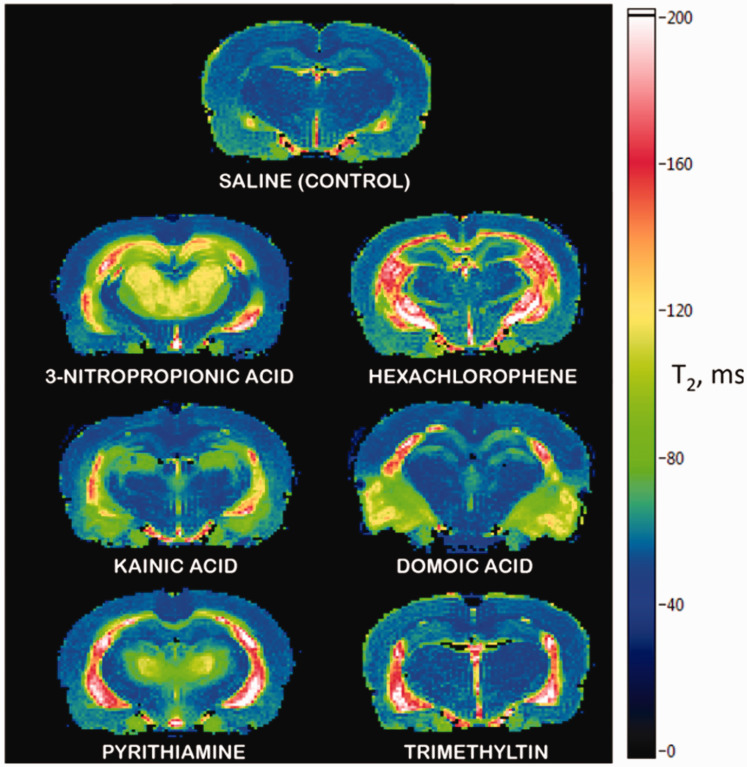
Figure 31.
Representative T2 maps for animals which showed signs of brain alterations in response to treatment with known neurotoxicants. Control animal treated with saline (2 ml/kg, once) 48 h before imaging; 3-nitropropionic acid was administered in a dose of 20 mg/kg, s.c., daily for three days, imaging on day 4; hexachlorophene was administered in a dose of 30 mg/kg, p.o. daily for five days, imaging on day 6; kainic acid was administered in a dose of 10 mg/kg, i.p., once, imaging on day 3; domoic acid was administered in a dose of 2 mg/kg, i.p., once, imaging on day 3; pyrithiamine was administered in a dose of 0.25 mg/kg i.p. daily for two weeks + thiamine free diet, imaging at four weeks; trimethyltin was administered in a dose of 12 mg/kg, i.p., once, imaging at three weeks.

