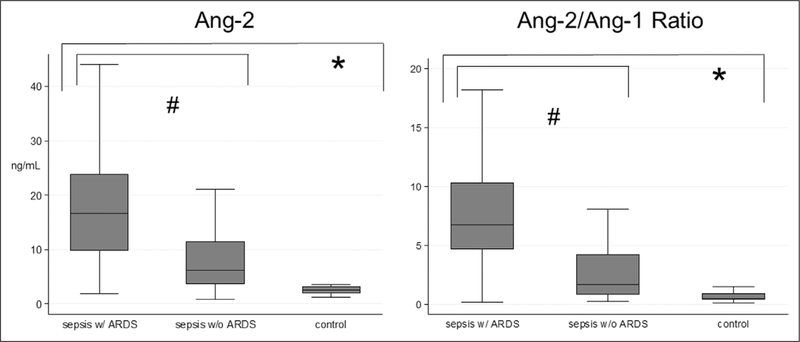
Figure 1.
Time 1 angiopoietin (Ang)-2 and Ang-2/Ang-1 ratio by group. Data are shown as boxplots with the horizontal line of each box representing the median, the ends of the box representing the 25th and 75th percentiles, and the whiskers representing the most extreme values within 1.5 times the interquartile range. Wilcoxon rank sum test was used to compare biomarkers between groups. *Significance defined as p value less than 0.0033 given multiple comparisons between controls versus all extrapulmonary sepsis. #Significance defined as p < 0.0033 given multiple comparisons between extrapulmonary sepsis with (w/) versus without (w/o) acute respiratory distress syndrome (ARDS).

