FIG 6.
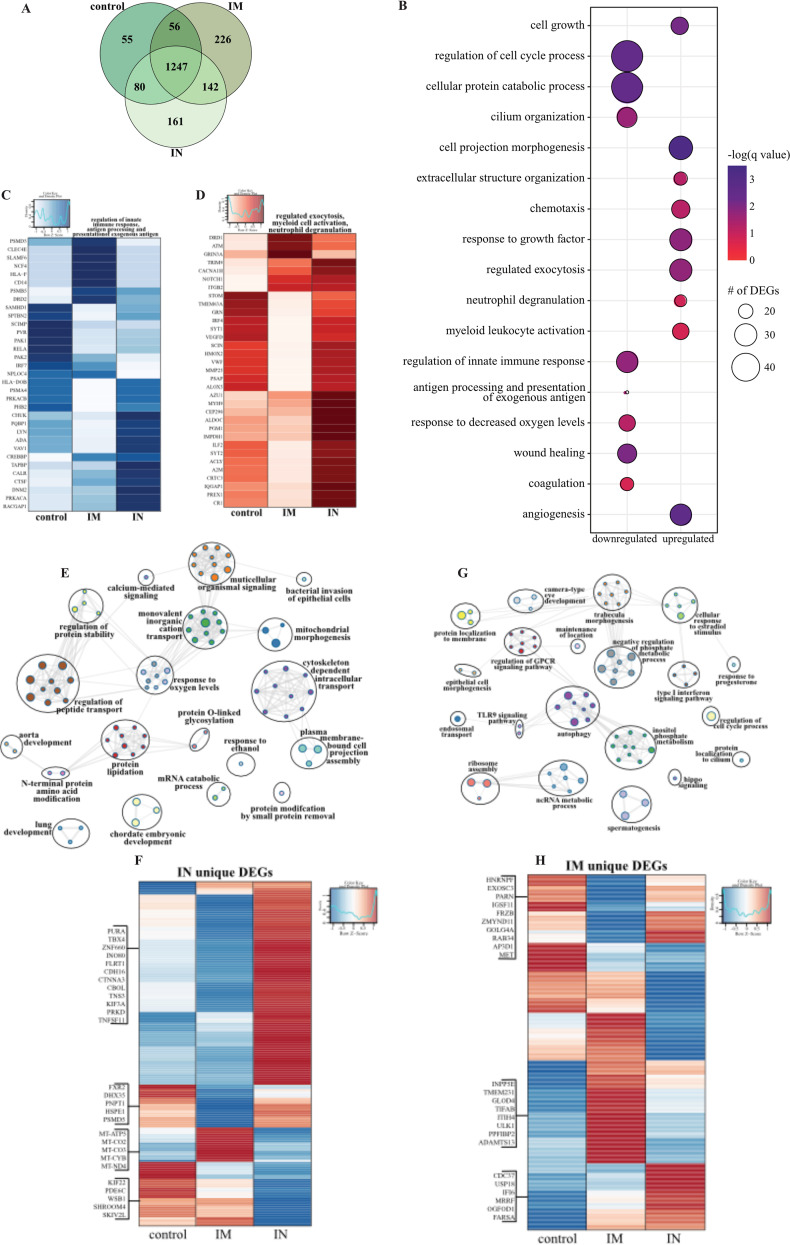
Lung RNA sequencing. (A) Venn diagram of DEGs expressed dpc 7 with SARS-CoV-2. Animals received either a control, intramuscular (IM), or intranasal (IN) vaccination. (B) Bubble plot representing functional enrichment of DEGs shared by all infected groups at dpc 7. The color intensity of each bubble represents the negative logarithm of a P value, and the relative size of each bubble represents the number of DEGs belonging to the specified GO term. (C and D) Heatmaps representing the shared GO terms “regulation of innate immune response” and “antigen processing and presentation of exogenous antigen” for downregulated DEGs (C) and “regulated exocytosis,” “myeloid leukocyte activation,” and “neutrophil degranulation” for upregulated DEGs (D). Expression is represented as the normalized number of rpkm, where each column represents the median rpkm of the given group. The range of colors is based on a scale and centered rpkm values of the represented DEGs. (E and G) GO term network depicting functional enrichment of DEGs unique to i.n. (E) and i.m. (G) vaccinated groups using Mediascape. Color-coded clustered nodes correspond to one GO term or KEGG pathway. Node size represents the number of DEGs associated with the indicated term or pathway. Gray lines represent shared interactions between terms/pathways, with density and number indicating the strength of connections between closely related terms/pathways. GPCR, G protein-coupled receptor; ncRNA, noncoding RNA. (F and H) Heatmaps representing DEGs unique to i.n. (F) and i.m. (H) vaccinated groups. Exemplar DEGs are annotated. Red represents upregulation, and blue presents downregulation. Each column represents the median number of rpkm of the given group. For all heatmaps, the range of colors is based on a scale and centered rpkm values of the represented DEGs.

