FIG 2.
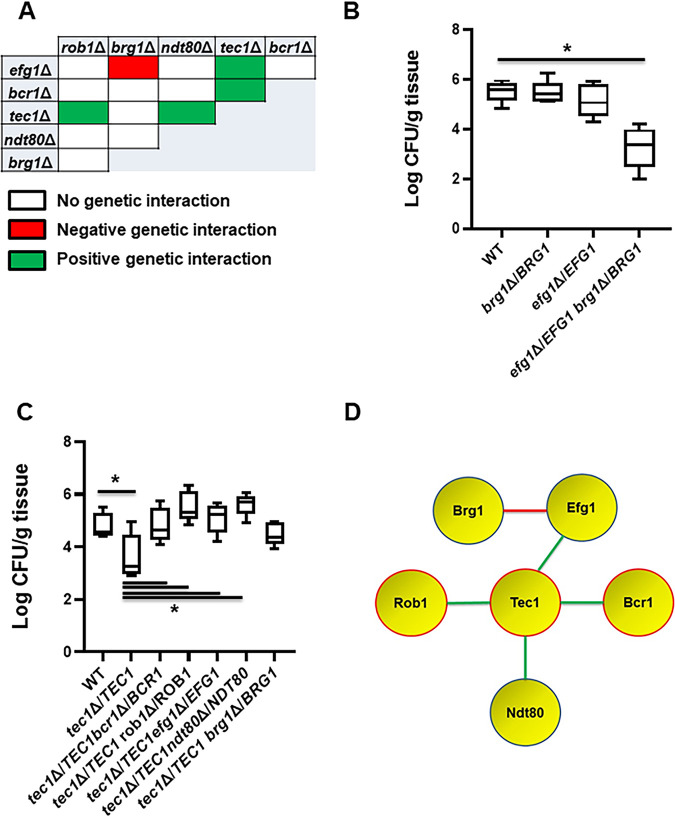
Genetic interaction analysis of transcription factors in a mouse model of oropharyngeal candidiasis identifies a functional network. (A) The set of all possible double heterozygous transcription factor deletion mutants was screened for genetic interactions relative to the individual heterozygotes. The interaction map summarizes these interactions with negative interactions indicated in red, positive interactions indicated by green, and no interaction indicated by white. (B) The double heterozygous efg1Δ/EFG1 brg1Δ/BRG1 mutant shows complex haploinsufficiency in the oropharyngeal candidiasis model. The log10-transformed fungal burden data, means and standard deviations, for each experiment were analyzed by one-way ANOVA followed by post hoc Student's t test to identify statistically significant differences between individual strains (P < 0.05). Strains that were statistically different from the WT are indicated with an asterisk. (C) BCR1, ROB1, NDT80, and EFG1 show positive genetic interactions with tec1Δ/TEC1. (D) The functional interaction network based on genetic interactions shown by the indicated transcription factors. Deletion mutants of genes highlighted in red have reduced infectivity. Red lines indicate a negative genetic interaction, while green lines indicate a positive genetic interaction.

