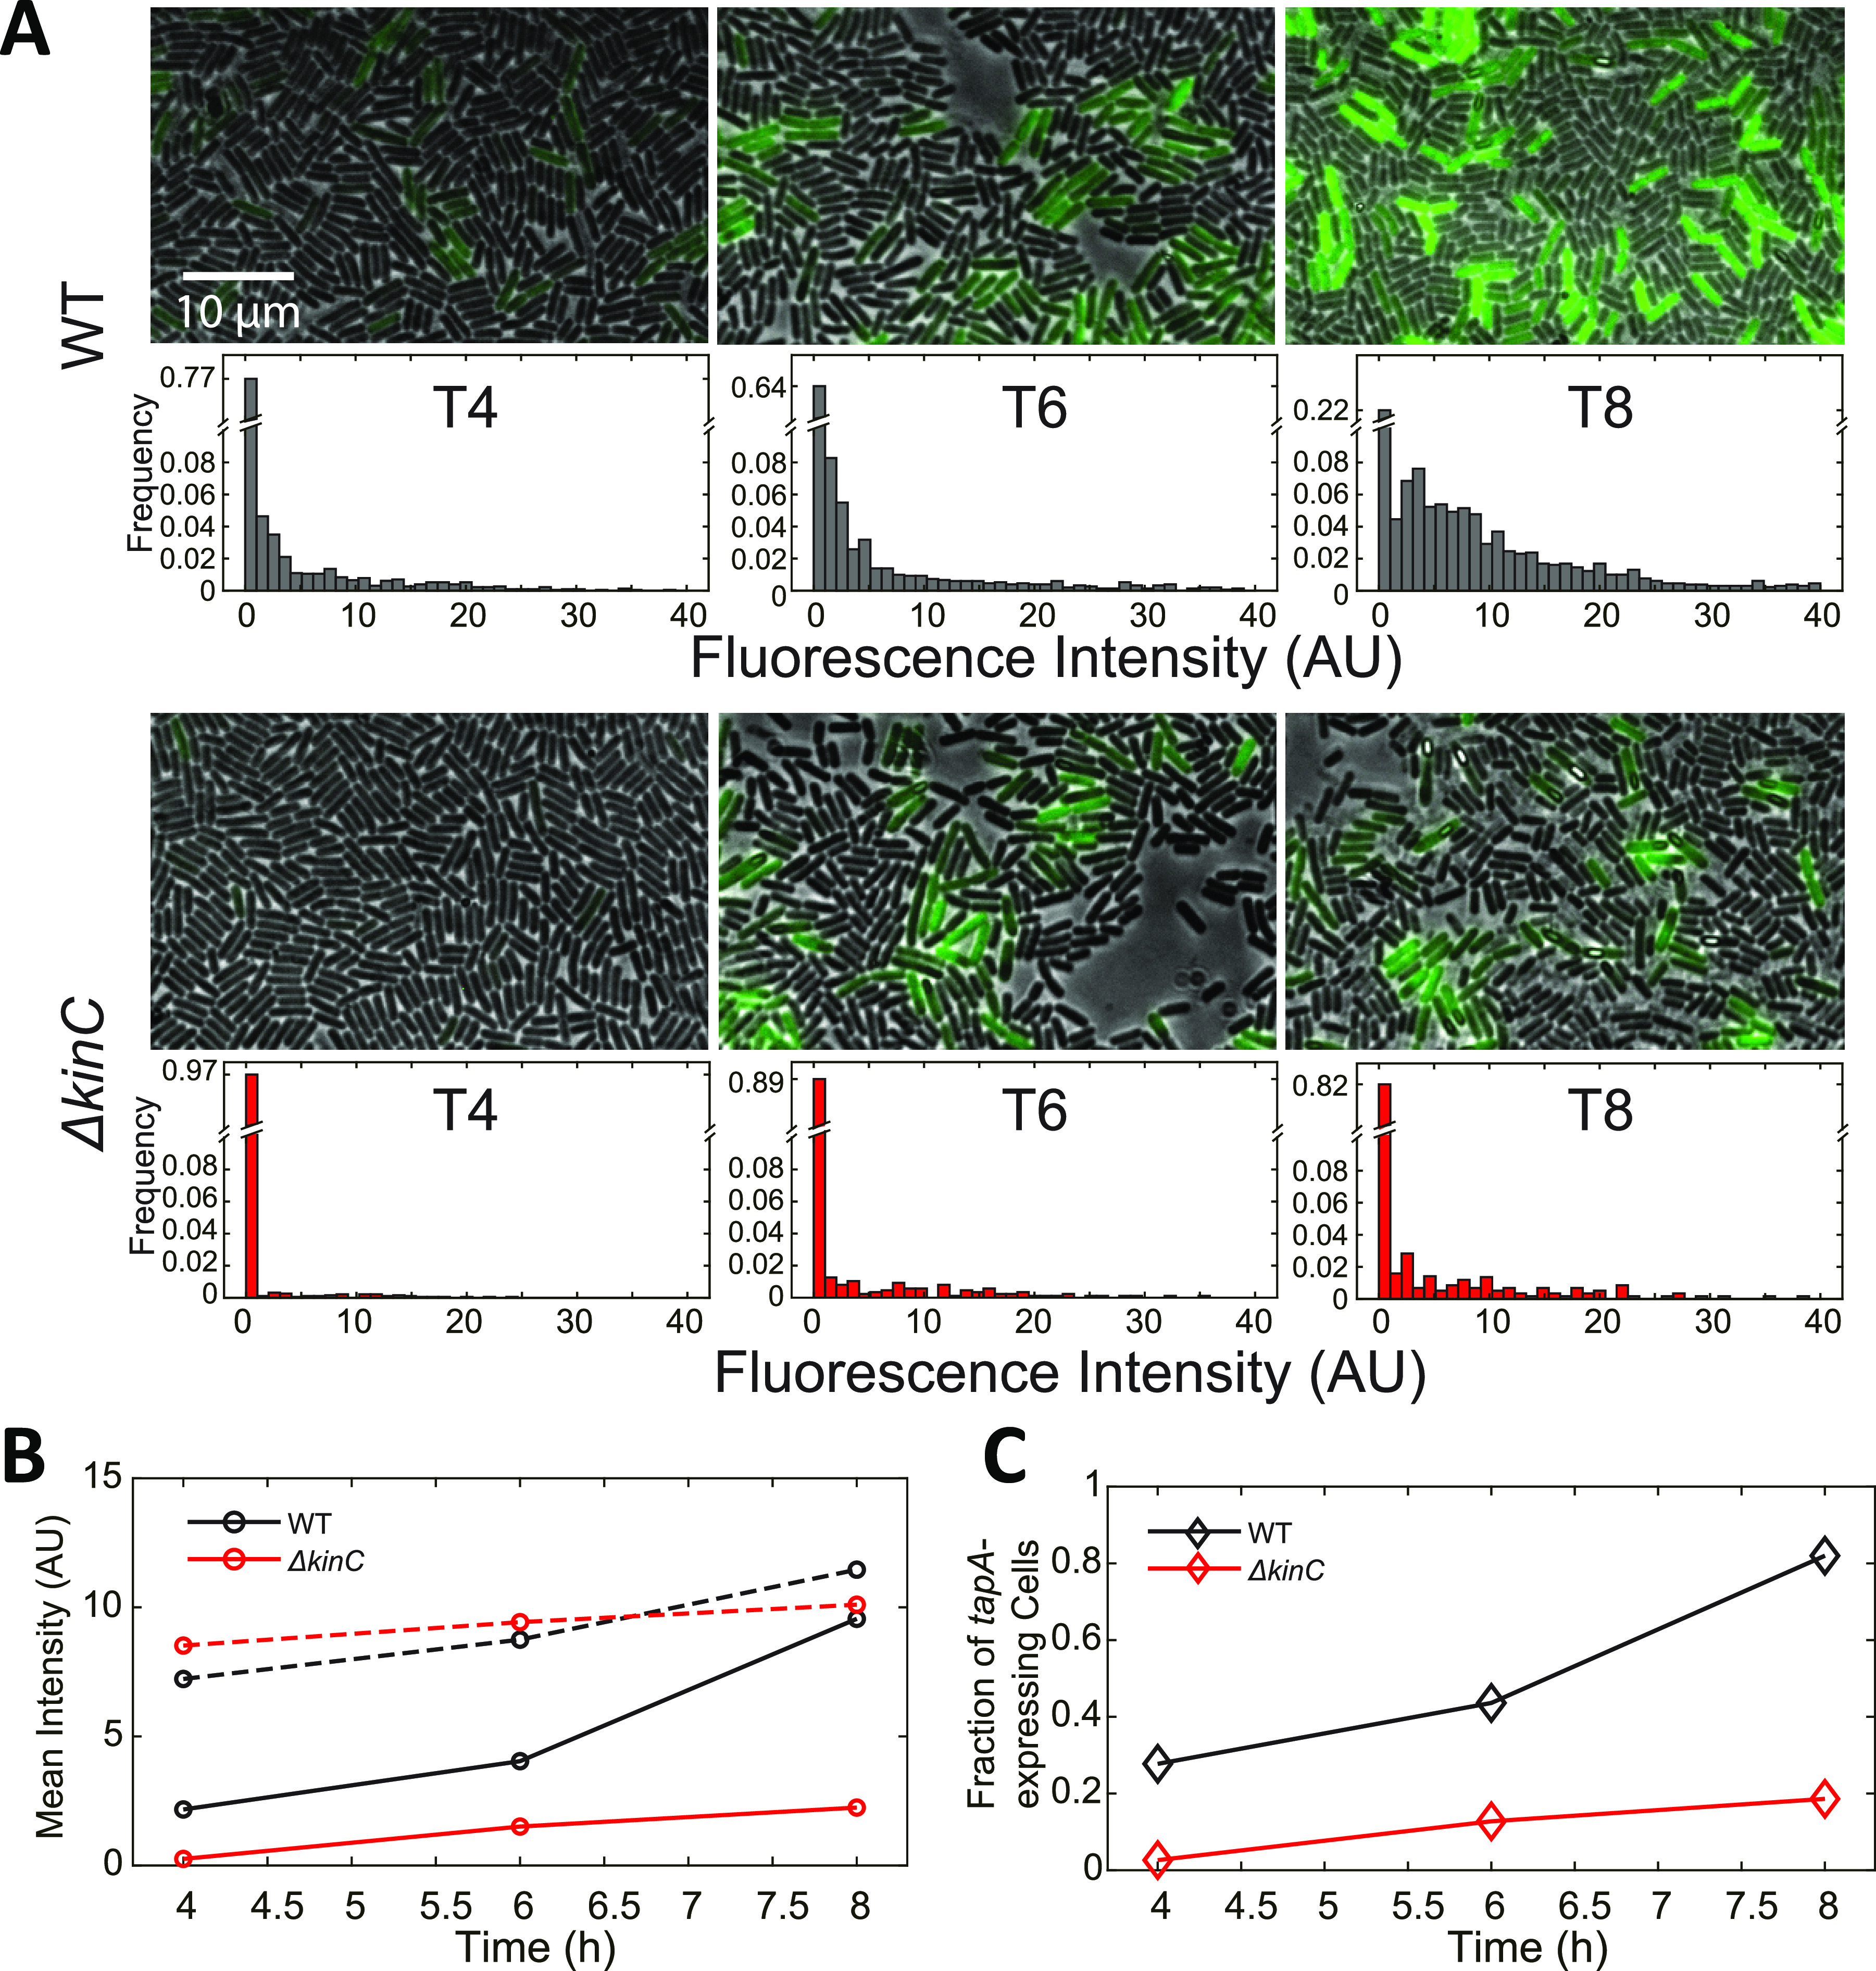
FIG 5.

Fluorescence measurements for PtapA activity in individual cells. (A) Fluorescence-microscopic images of WT and ΔkinC cells harboring PtapA-gfp reporter at different times. The scale bar applies to all the images. The GFP channel is shown in green pseudocolor. Each of the strains was cultured in liquid MSgg. The distribution of mean fluorescence intensity of cells is plotted under each image. The value of the first bin was labeled on each histogram axis. (B) Mean fluorescence intensities of all cells (solid line) and tapA-expressing cells (dashed line) at T4, T6, and T8. (C) Fractions of tapA-expressing cells of WT and ΔkinC strains at T4, T6, and T8.
