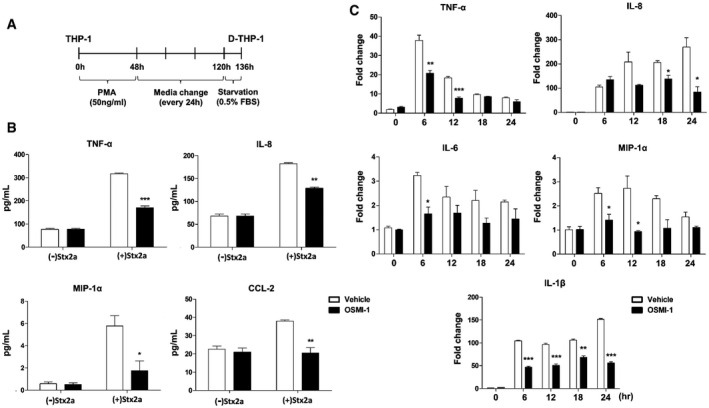
Figure 2. Suppression of O‐GlcNAcylation downregulates pro‐inflammatory cytokine/chemokine production induced by Stx2a intoxication.

- Timeline for establishment of differentiated macrophage‐like THP‐1 cells (D‐THP‐1) from monocytic THP‐1 cells.
- ELISAs were used to analyze the inhibitory effect of OSMI‐1 (10 µM, final) on cytokine and chemokine production from THP‐1 cells exposed to Stx2a (10 ng/ml) for 9 h (n = 3 biological replicates).
- Real‐time qRT‐PCR analyses of fold changes in transcript levels for each cytokine/chemokine gene in D‐THP‐1 cells following Stx2a (10 ng/ml) intoxication for various time points in the presence or absence of OSMI‐1 (10 µM, final). Data are normalized using GAPDH as a loading control (n = 3 biological replicates).
Data information: For graphs in (B and C), error bar represents mean ± SEM. Statistical analysis was performed using two‐tailed Student’s t‐test. *P < 0.05; **P < 0.01; and ***P < 0.001. The effects of OSMI‐1 were compared with those of the vehicle (DMSO) control at each time point.
Source data are available online for this figure.
