
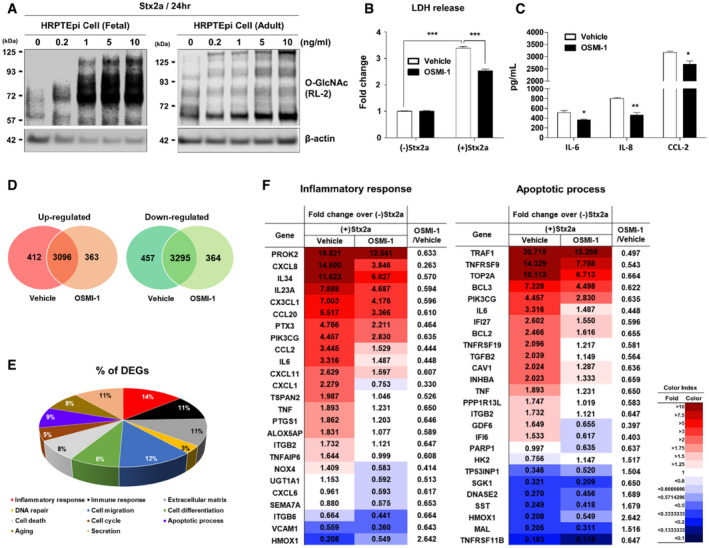
Figure 4. Stx2a‐mediated apoptotic and pro‐inflammatory responses in primary human renal cells are regulated through O‐GlcNAcylation.
-
ARepresentative western blot showing the changes in O‐GlcNAcylation in primary human renal proximal tubule epithelial (HRPTEpi) cells (originating from fetal or adult kidney) treated with different concentrations (0–10 ng/ml) of Stx2a for 24 h.
-
BLDH cytotoxicity assay following Stx2a (10 ng/ml) treatment of HRPTEpi (adult) cells for 48 h in the presence or absence OSMI‐1 (10 µM, final) (n = 3 biological replicates). The effects of Stx2a in vehicle controls were compared with culture medium prepared from HRPTEpi cells maintained in the absence of Stx2a, and OSMI‐1 treatment was compared with that of the vehicle (DMSO) controls in the presence of Stx2a.
-
CELISAs were used to analyze the inhibitory effect of OSMI‐1 on cytokine/chemokine production from HRPTEpi cells (adult) exposed to Stx2a (10 ng/ml) for 48 h (n = 3 biological replicates). The effects of OSMI‐1 were compared with those of the vehicle (DMSO) control.
-
D–FGlobal transcriptome analysis of differentially expressed genes of HRPTEpi cells during Stx2a intoxication with vehicle or 10 µM of OSMI‐1, respectively. (D) Venn diagram of overlapping differentially expressed genes (DEGs) in the presence or absence of OSMI‐1 treatment among Stx2a‐inducible genes compared to cells cultured without Stx2a. (E) Pie chart showing genes significantly regulated by OSMI‐1 in the Stx2a‐exposed HRPTEpi cells as categorized by function. (F) Heatmaps representing the comparative expression levels for DEGs in the presence or absence of OSMI‐1 treatment upon Stx2a intoxication related to the inflammatory response (left) and apoptotic process (right). The numbers within the tables are normalized gene expression level compared to HRPTEpi cells maintained in the absence of Stx2a. Expression values are represented with red (upregulation) or blue (downregulation) color using FPKM values by Cufflinks; the cutoffs used a fold change of at least 1.5 followed by pairwise comparison and Student’s t‐test with a Benjamini and Hochberg correction. The FPKM values were normalized using EdgeR within R and visualized using ExDEGA. Data are the means from two independent replicates.
Data information: For graphs in (B and C), error bar represents mean ± SEM. Statistical analysis was performed using two‐tailed Student’s t‐test. *P < 0.05; **P < 0.01; and ***P < 0.001.
Source data are available online for this figure.