
Figure EV4. Stx2a‐mediated immune responses in primary human renal cells are regulated through O‐GlcNAcylation.
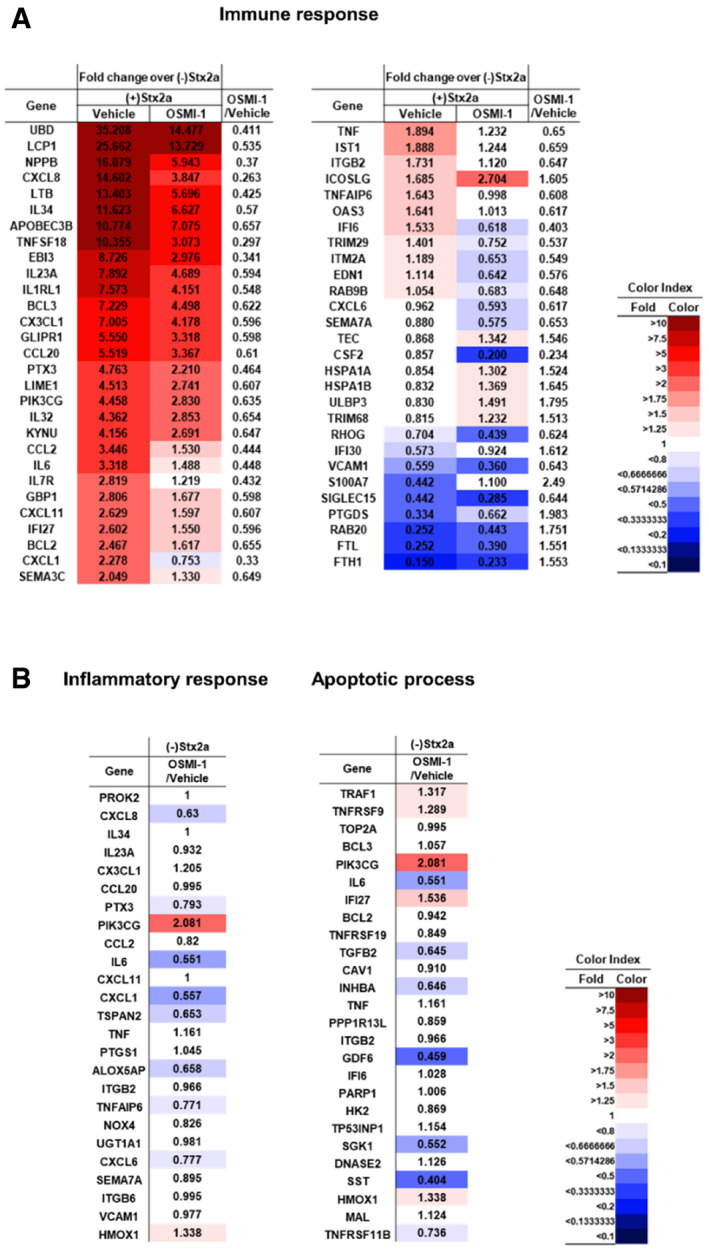
- Heatmaps representing the comparative expression levels for DEGs in the presence or absence of OSMI‐1 treatment upon Stx2a intoxication related to the immune responses.
- Heatmaps representing the comparative expression levels for DEGs in the presence or absence of OSMI‐1 treatment without Stx2a exposure related to the inflammatory response (left) and apoptotic process (right).
Data information: The numbers within the tables are normalized gene expression level compared to HRPTEpi cells maintained in the absence of either Stx2a or OSMI‐1. Expression values are represented with red (upregulation) or blue (downregulation) color using FPKM values by Cufflinks; the cutoffs used a fold change of at least 1.5 followed by pairwise comparison and Student’s t‐test with a Benjamini and Hochberg correction. The FPKM values were normalized using EdgeR within R and visualized using ExDEGA. Data are the means from two independent replicates.