
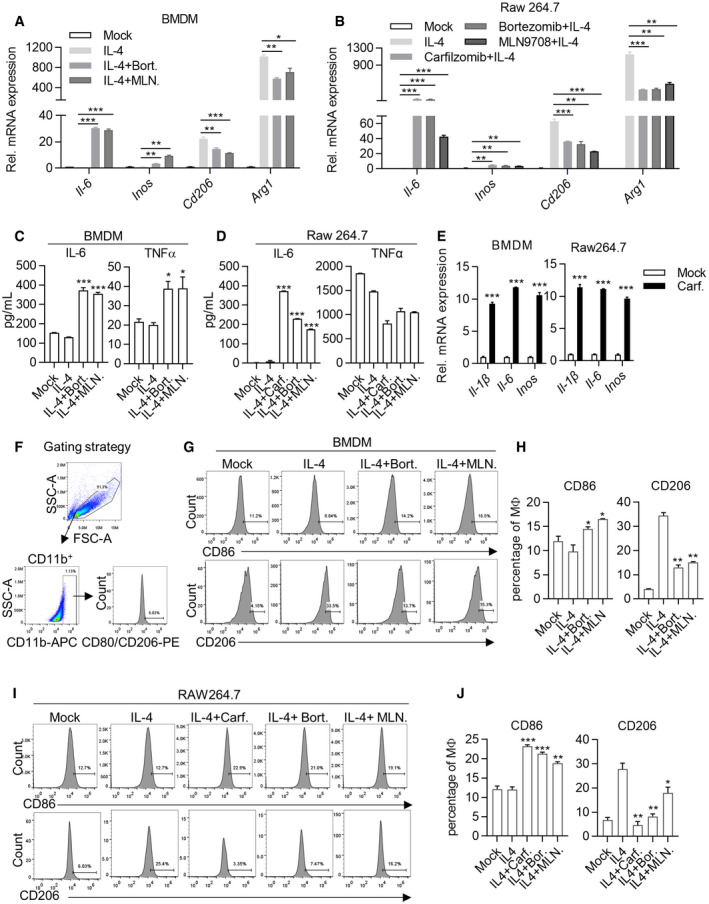
Figure EV2. Carfilzomib, Bortezomib and MLN9708 reprogram M2 macrophages into M1‐like population.
-
A, BCarfilzomib, Bortezomib, and MLN9708 promote the expression of M1 macrophage markers and reduce the expression of M2 macrophage markers in macrophages. BMDMs (A) and Raw264.7 cells (B) were treated as Fig 1F and G. RNA was extracted from cells and the expression of M1 (Il‐6/Inos) or M2 (Cd206/Arg1) macrophage markers was quantified through RT‐qPCR 6 h after stimulation. Data are means ± SD of three independent experiments. *P < 0.05, **P < 0.01, ***P < 0.001 (Student’s t‐test).
-
C, DCarfilzomib, Bortezomib, and MLN9708 promote the secretion of IL‐6 and TNFα in M2 macrophages. BMDMs (C) and Raw264.7 cells (D) were pretreated by IL‐4 (20 ng/ml) for 24 h, then stimulated by DMSO, Carfilzomib (500 nM), Bortezomib (500 nM), or MLN9708 (500 nM). Secretion of IL‐6 and TNFα in culture media was detected through ELISA 24 h after stimulation. Data are means ± SD of three independent experiments. *P < 0.05, ***P < 0.001 (Student’s t‐test).
-
ECarfilzomib alone promotes the expression of proinflammatory cytokines. BMDMs and Raw264.7 cells were treated by DMSO or Carfilzomib (1 μM) for 6 h, then RNA was extracted from cells, and the expression of Il‐1β/Il‐6/Inos were quantified through RT‐qPCR. Data are means ± SD of three independent experiments. ***P < 0.001 (Student’s t‐test).
-
FGating strategy for analyzing M1/M2 macrophage surface markers in macrophages. CD86‐ or CD206‐positive cells were gated on CD11B+ cells.
-
G–JCarfilzomib, Bortezomib, and MLN9708 promote the expression of membrane protein CD86 and reduce CD206. BMDMs (G) and Raw264.7 cells (I) were treated as described in Fig S2C and D. The representative histogram of CD86 and CD206 expression was shown for flow cytometry 12 h after stimulation. (H, J) Statistics represent the proportion of CD86‐ or CD206‐positive cells in BMDMs (H) or Raw264.7 cells (J) under different treatment conditions. Data are means ± SD of three independent experiments. *P < 0.05, **P < 0.01, ***P < 0.001 (Student’s t‐test).