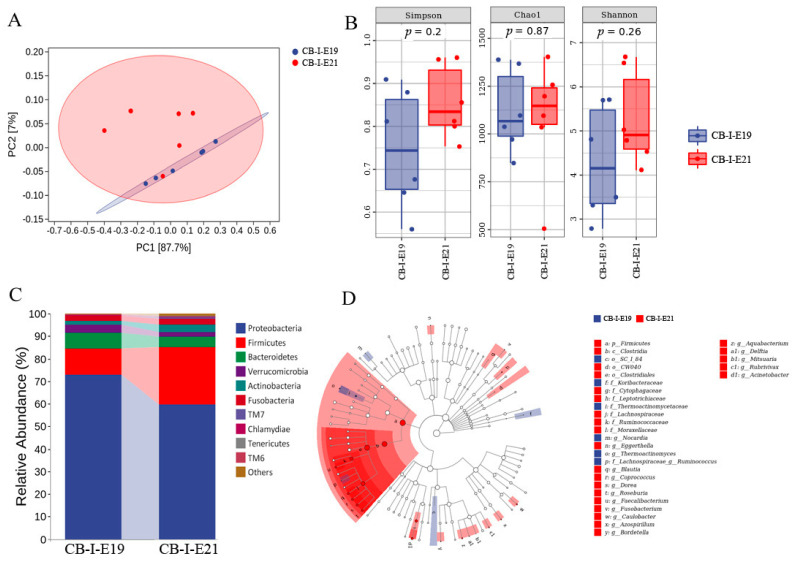
Figure 5.
Early changes of intestinal microbiota in chicken embryos. (A) PCA: Each point represents a sample, and points of different colors indicate different groups. (B) Each panel corresponds to an alpha diversity index, which is identified in the gray area at the top. In each panel, the abscissa is the group label, and the ordinate is the value of the corresponding alpha diversity index. (C) The relative abundance of intestinal microbiota at E19 and E21 (at the phylum level). (D) Taxonomic cladogram generated from LEfSe showing significant difference in the microbiota profile of intestinal microbiota at E19 and E21. CB in the picture represents commercial broilers and I represent intestine.

