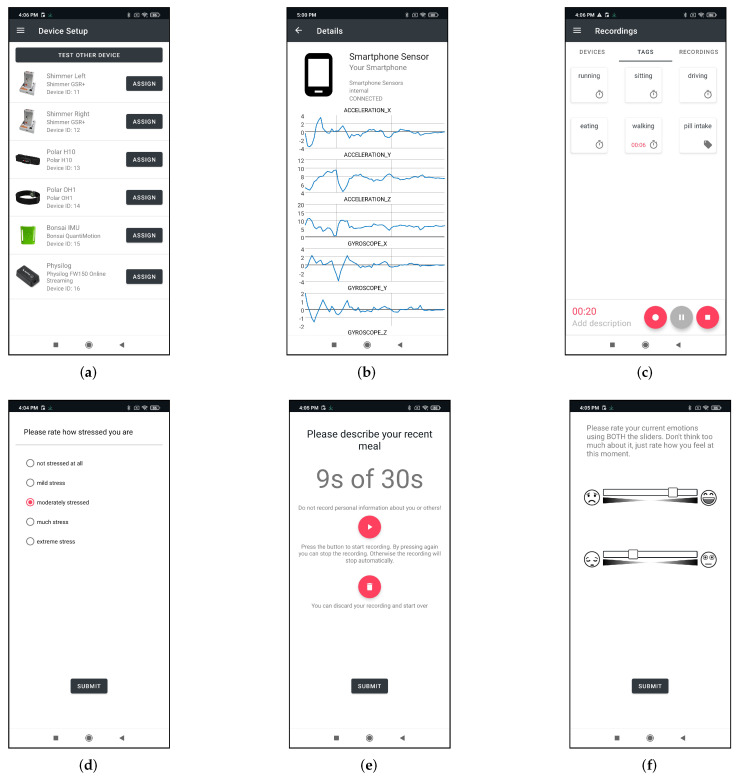
Figure 6.
Different views from the SensorHub Android application. (a) Device Setup screen showing the defined devices for a study, (b) Streaming data visualization of the sensors from the smartphone, (c) Recordings screen with six predefined tags where one is active, (d) Exemplary questionnaire with a Likert scale, (e) Example for an audio recording questionnaire, (f) Sample questionnaire screen using affective sliders.

