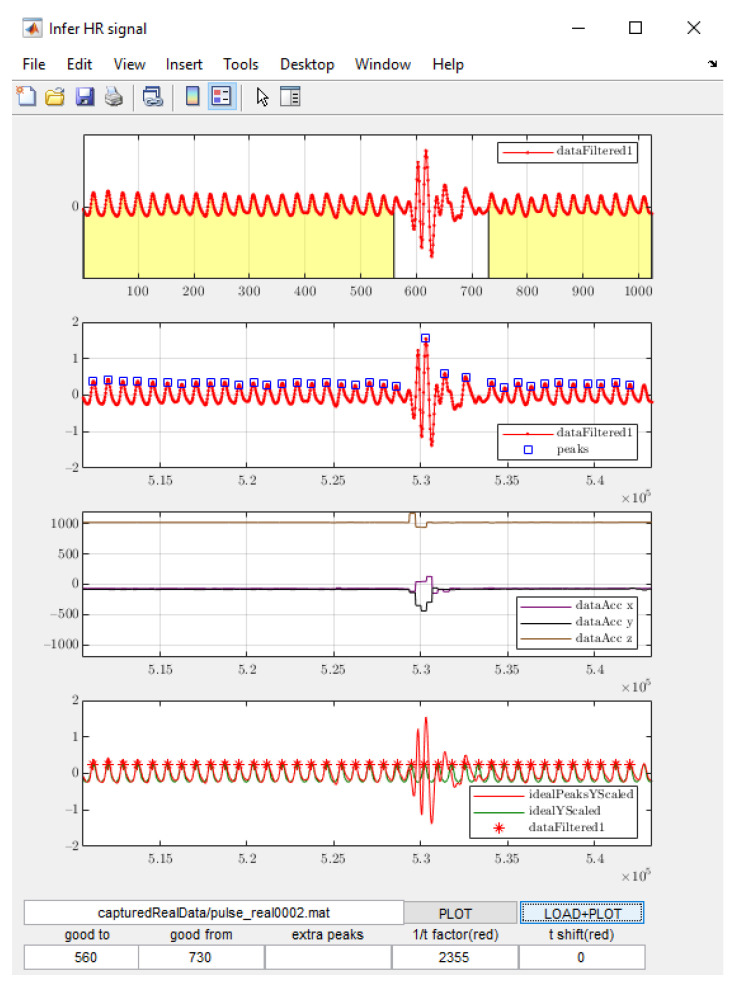
Figure 3.
Application for manual selection of undisturbed parts of the signals. Time Window A and Time Window B are marked in yellow in the top graph. The fields “good to” and “good from” at the bottom of the GUI window denote the sample number at the end of Time Window A and at the start of Time Window B, respectively.

