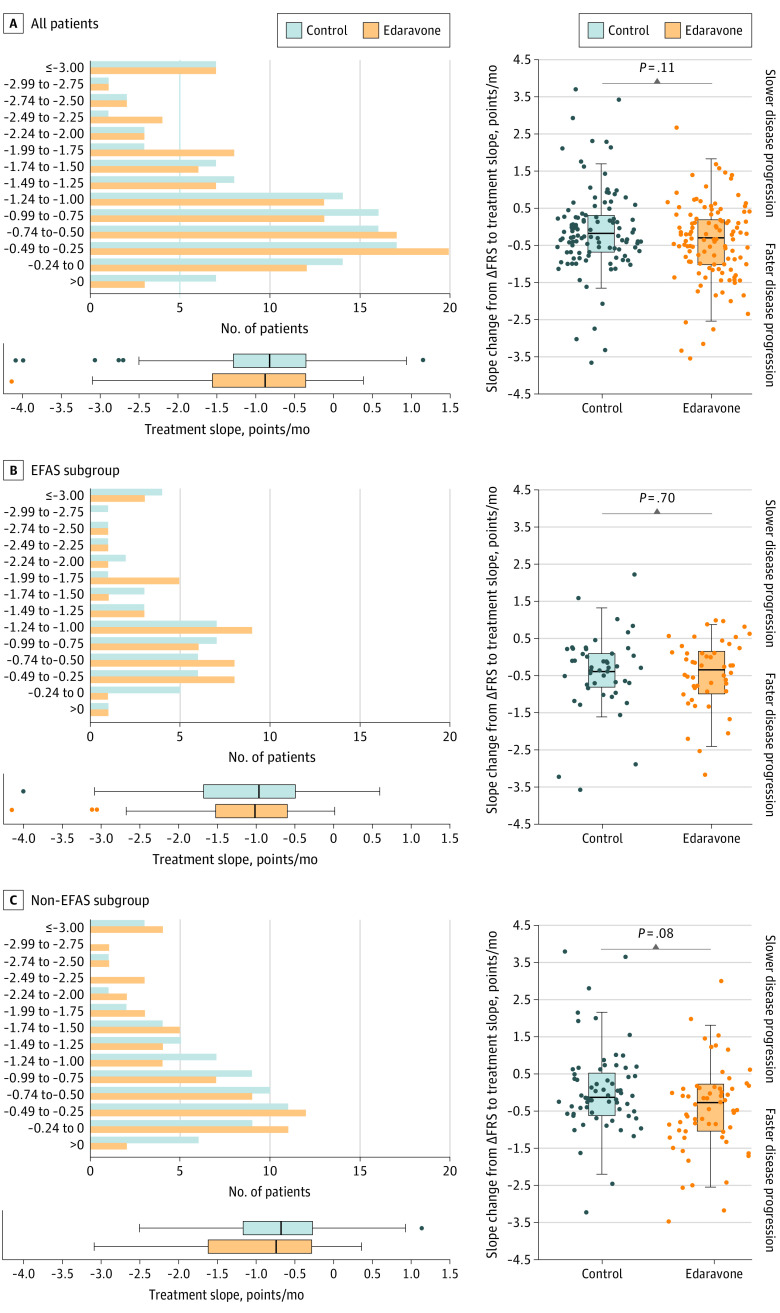
Figure 2. Disease Progression in the Propensity Score–Matched Sample.
Left panels show treatment slope in amyotrophic lateral sclerosis (ALS) Functional Rating Scale–Revised (ALSFRS-R) score points per month during follow-up for all patients, EFAS subgroup, and non-EFAS subgroup. Box and whisker plots show median (central line), IQR (boxes), and 1.5 × IQR (whiskers), with individual points representing outliers. Right panels showing individual changes in ALSFRS-R slopes from ΔFRS (before baseline) to treatment slopes (follow-up) are displayed with box plots for groups (median, central line; IQR, boxes, and 1.5 × IQR, whiskers) overlaid with dots for single patients. Negative values signify faster disease progression during follow-up. Wilcoxon signed rank tests were used to compare treatment groups. ΔFRS indicates change in ALSFRS-R slope between disease onset and baseline; EFAS, subgroup of patients potentially eligible for the MCI186-ALS19 study; and non-EFAS, subgroup ineligible for the MCI186-ALS19 study.

