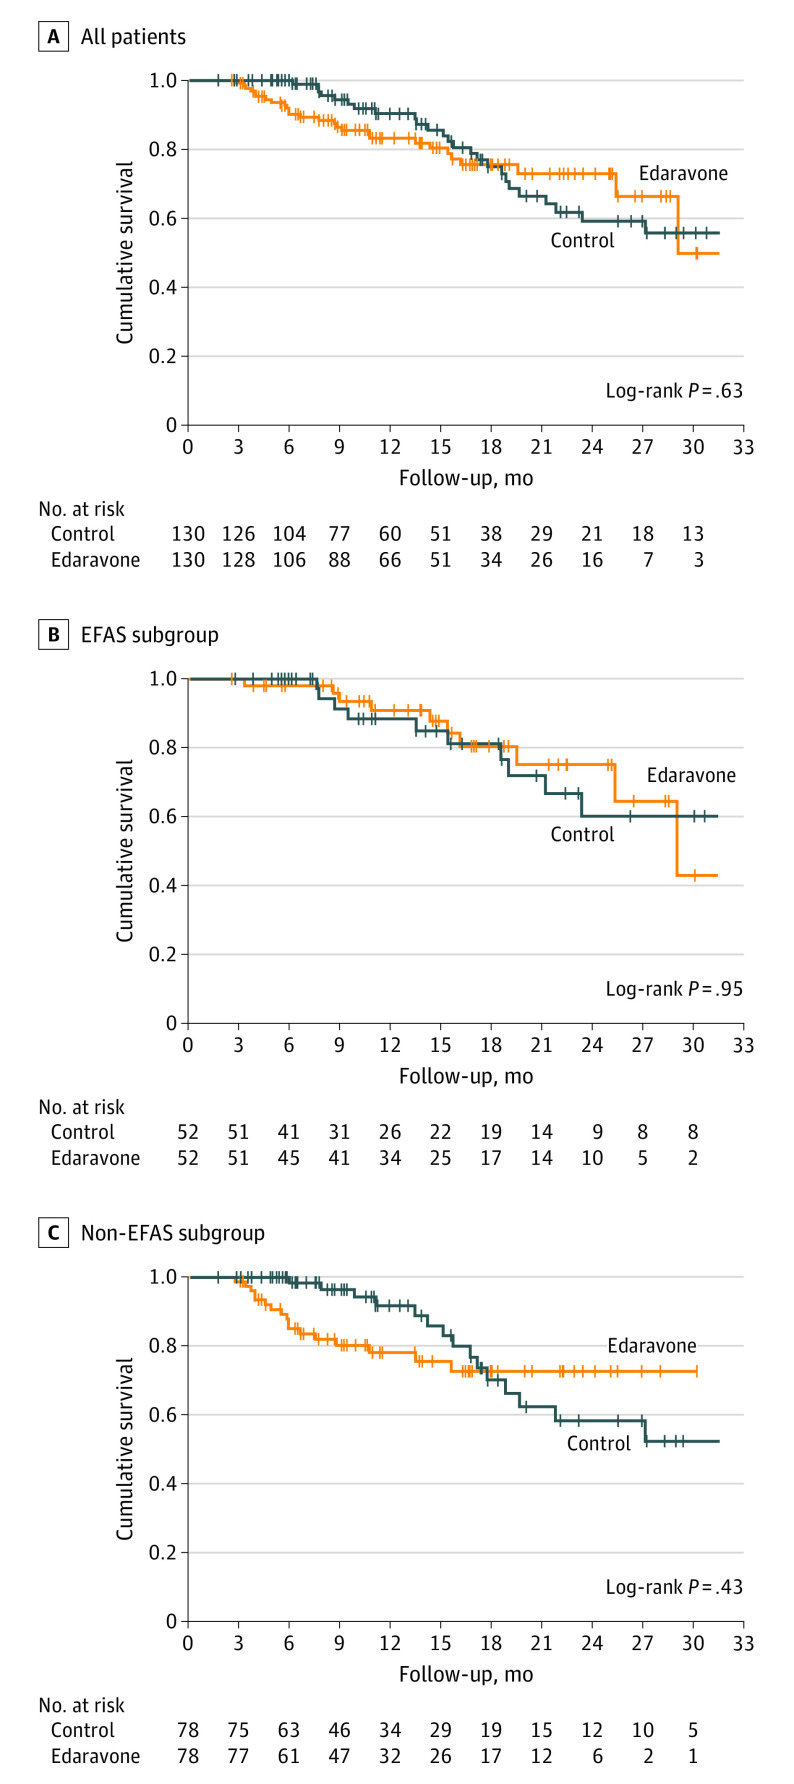
Figure 3. Kaplan-Meier Plots for Survival Probability During Follow-up.
Panels show the propensity score–matched sample for survival probability analysis. If not deceased, control patients were censored at last visit. Patients receiving edaravone who discontinued therapy were censored at the time of discontinuation, and patients with ongoing follow-up were censored at the last patient contact. EFAS indicates potentially eligible for the MCI186-ALS19 study; non-EFAS, ineligible for the MCI186-ALS19 study.

