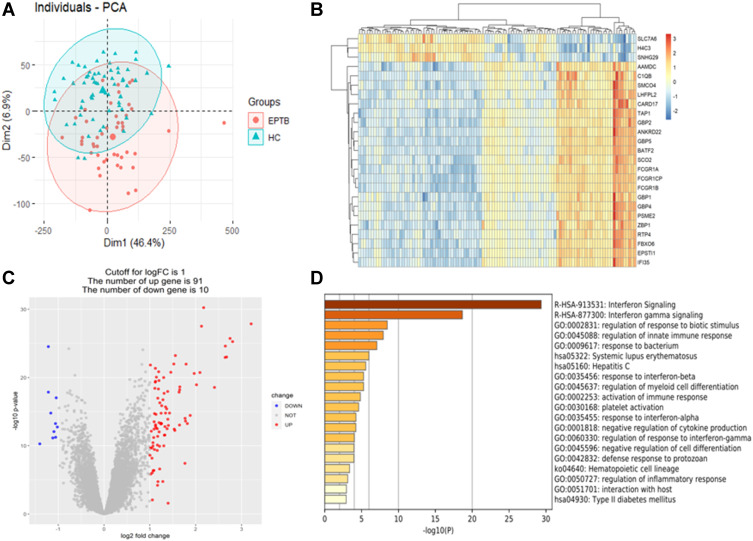
Figure 1.
Difference analysis and signaling pathway enrichment. (A) Principal component analysis diagram, red dots for extra-pulmonary tuberculosis, blue triangles for healthy control. (B) Heatmap was drawn for the top 25 differentially expressed genes set. (C) Differentially expressed genes set drew a volcanic map, 91 red dots represented up-regulated genes and 10 blue dots represented down-regulated genes. (D) Metascape analyzed of the first 20 significant enrichment pathways of differentially expressed genes set.

