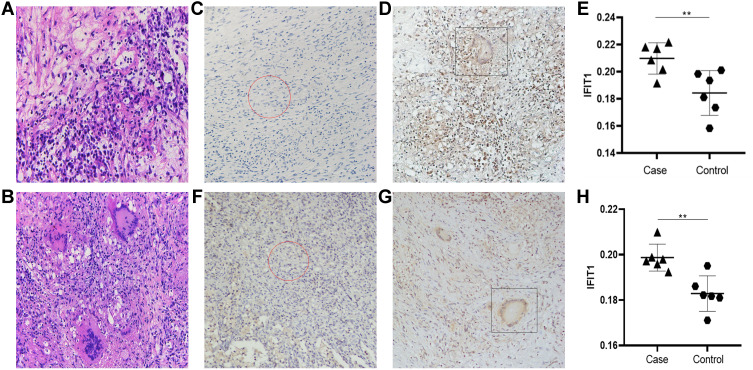
Figure 4.
Hematoxylin and Eosin staining and IFIT1 typical IHC staining results and analysis. (A and B) Central nervous system tuberculosis hematoxylin and eosin (H&E) staining of lesion tissue and control tissue. (C–E) Central nervous system tuberculosis IFIT1 typical Immunohistochemistry staining. (F–H) Tuberculosis IFIT1 typical Immunohistochemistry staining. **p<0.05, The difference was statistically significant.

