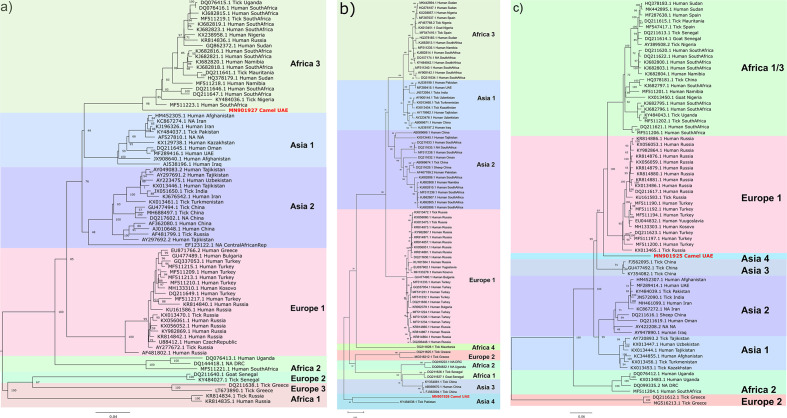
Fig. 1.
Maximum-likelihood tree for CCHFV by segment. Maximum-likelihood tree analysis conducted with unique complete CCHFV genome sequences obtained from the NCBI and the current study’s sequences. Sequences of complete segments were aligned with muscle aligner and maximum-likelihood analysis was conducted using the GTR+G+I model with 1000 bootstraps. Bootstrap values of 40 or above are noted. Bars indicate the nucleotide substitution per site. Tips are labelled with NCBI accession number, organism source and country. na indicates that information was not available. CCHFV sequences from camels sequenced in this study are indicated with red tips. (a) S segment, (b) M segment and (c) L segment.

