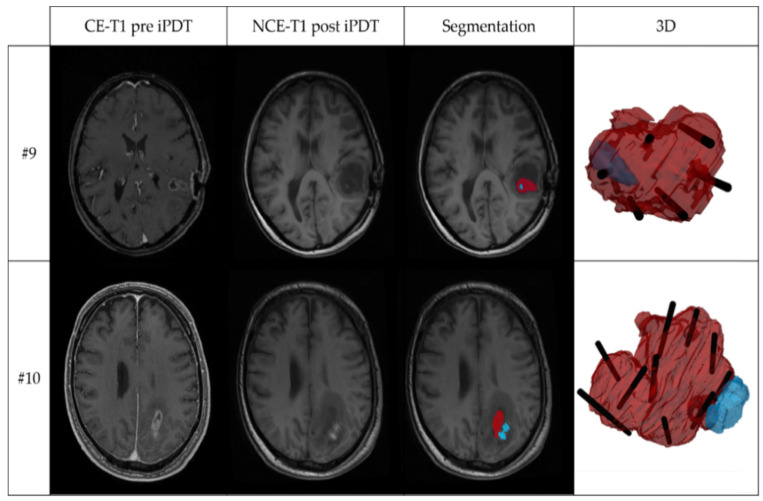
Figure 3.
Two examples of MRI and 3D superimposition visualization, showing: contrast-enhanced T1-weighted MRI before iPDT (CE-T1 pre iPDT); non-contrast-enhanced T1-weighted MRI after iPDT (NCE-T1 post iPDT); segmentation of the tumor volume (red) and intrinsic T1 hyperintensity (blue) based on the CE-T1 pre iPDT and NCE-T1 post iPDT images; and 3D superimposition of tumor volume (red), intrinsic T1-hyperintensity volume (blue), and planned localization of irradiating tips of cylindrical diffuser fibers (black). The upper panel shows iPDT case #9 with the largest overlap coefficient (OV = 0.99); the lower panel iPDT case #10 with smallest overlap coefficient (OV = 0.02).

