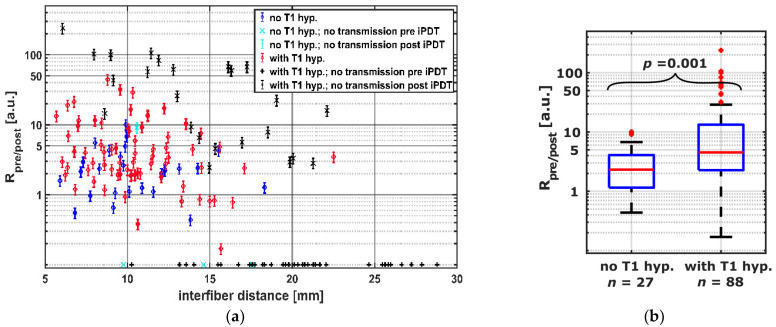
Figure 5.
(a) Transmission ratios Rpre/post for all CDF-pairs compared to interfiber distance. The colors and symbols indicate whether transmission was detectable post iPDT and whether T1 hyperintensity was observed (see legend). Crosses near the x-axis indicate CDF-pairs with no detectable treatment light transmission at iPDT start, for which Rpre/post is defined as 0. (b) Comparison of CDF-pairs with and without local intrinsic T1 hyperintensity, considering only CDF-pairs with detectable transmission pre iPDT and interfiber distance ≤ 19 mm.

