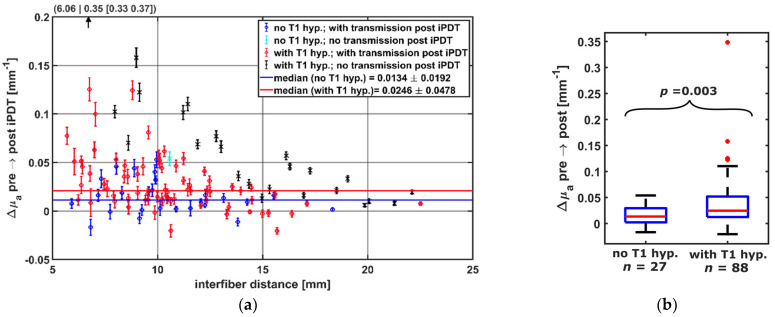
Figure 7.
(a) Calculated Δμa dependent on the interfiber distance between CDF-pairs. Colors indicate whether transmission was detectable post iPDT and whether intrinsic T1 hyperintensity was observed (see legend). For better visibility, the data point at (6.06|0.35) is omitted. (b) Comparison of Δμa of CDF-pairs with and without local intrinsic T1 hyperintensity, considering only pairs with transmission pre iPDT and interfiber distance ≤19 mm.

