
Fig. 5.
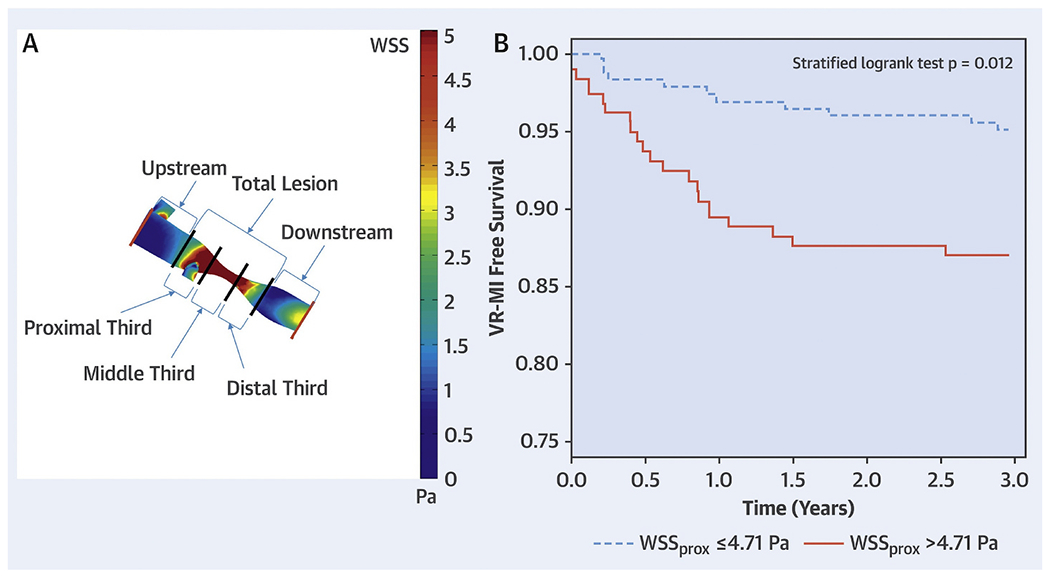
(A) Atherosclerotic lesion segmentation for wall shear stress calculation. Angiograms were used to create 3-dimensional geometric reconstructions of each patient’s target coronary vessel lumen. After performing computational fluid dynamics with patient-specific boundary conditions and identifying the lesion start points and endpoints, segment-specific wall shear stress values were generated by dividing the lesion into 5 segments: proximal, middle and distal thirds of the lesion; and 5-mm segments upstream and downstream to the lesion. The lesion wall shear stress values are displayed as a color-coded map. (B) Kaplan-Meier curves of vessel-related study population (n = 58) separated on the basis of wall shear stress measured in proximal segments of lesions to predict vessel-related myocardial infarction. Lesions with wall shear stress measured in proximal segments of lesions > 4.71 Pa had higher rates of vessel-related myocardial infarction than lesions with wall shear stress measured in proximal segments of lesions ≥4.71 Pa (p = 0.012). Pa = Pascal; WSSprox = WSS measured in the proximal segments of lesions; WSS = wall shear stress. (modified from Kumar A et al. JACC 2018)