
Fig. 6.
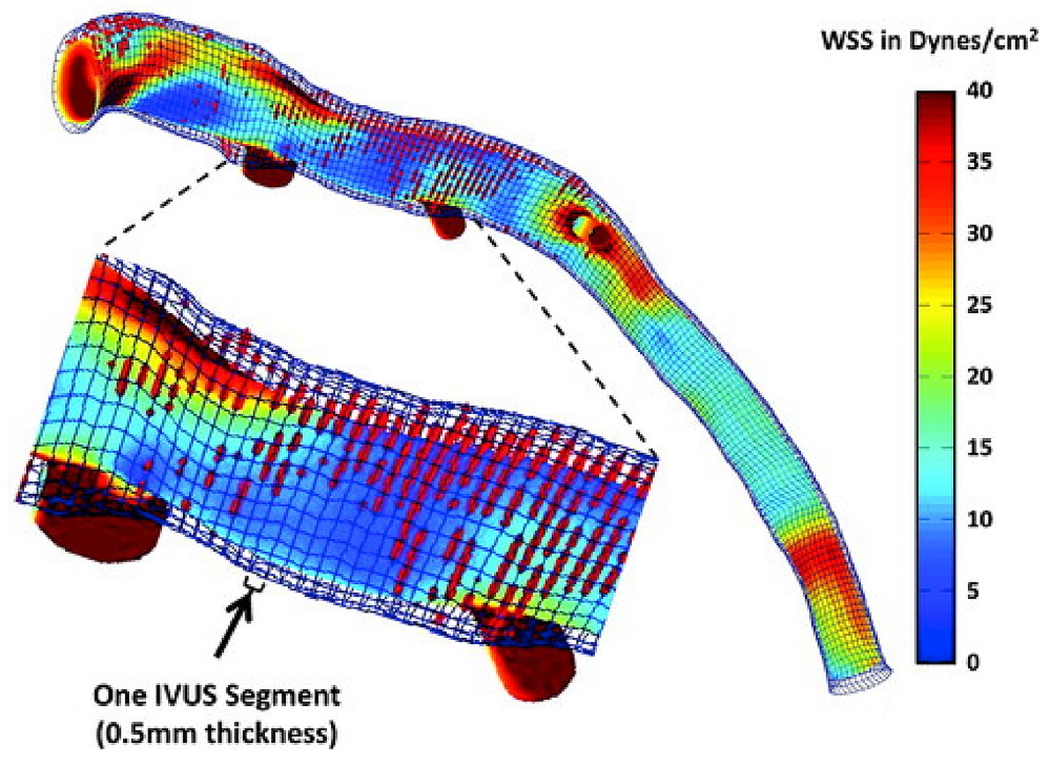
Example of a wall shear stress (WSS) profile of the left anterior descending coronary artery from a patient demonstrating lumen and external elastic membrane boundaries, superimposed virtual histology intravascular ultrasound (IVUS)–derived necrotic core data (red dots), and areas of variable WSS. The magnified segment of the vessel demonstrates the high-resolution spatial location of the IVUS images (thickness = 0.5 mm) superimposed on the WSS profile. Time-averaged WSS values were circumferentially averaged for each IVUS segment to provide quantitative hemodynamic data to correlate with plaque progression data.