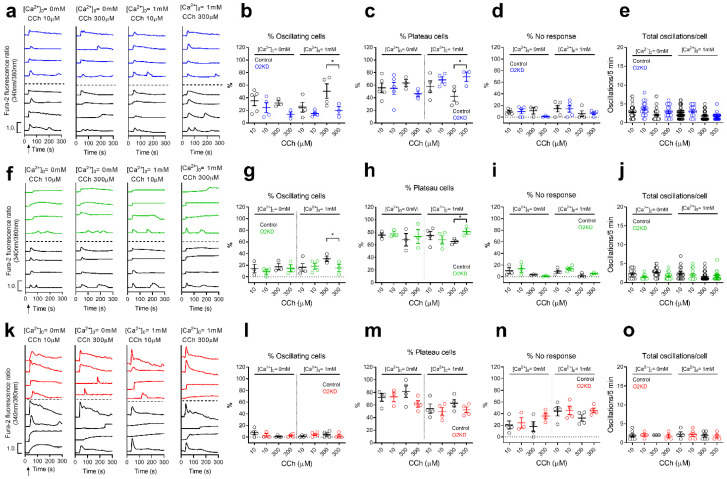
Figure 3.
Ca2+ oscillations induced by CCh in breast cancer cells are not affected by Orai2 knockdown. (a,f,k) Representative Ca2+ oscillations in response to 10 or 300 µM CCh measured using Fura2 in BT20 (a), SKBR3 (f) and T47D (k) cells transfected with esiOrai2 (color traces) or non-specific siRNA (black traces; control). Cells were superfused with HBSS containing 1 mM Ca2+ and stimulated with 10 or 300 µM CCh at 1 min (indicated by arrow in the first panel). Representative traces from 4 cells/condition were chosen to represent the datasets. (b–d,g,h,l–n) Quantification of the percentage of oscillating cells (b,g,l), percentage of plateau cells (c,h,m), and percentage of non-responding cells (d,i,n) for data presented in (a,f,k) (n = 3–5; n-values correspond to independent experiments). For data presented in (e,j,o), from left to right, n = 52, 25, 49, 18, 40, 15, 79 and 25 for panel (e), n = 13, 7, 28, 18, 16, 15, 49 and 18 for panel (j) and n = 10, 4, 3, 4, 3, 7, 7 and 4 for panel (o); n-values correspond to individual cells). The total number of cells analyzed in every condition is shown in Table S1. Scatter plots are represented as mean ± SEM and were statistically analyzed using ANOVA with multiple comparisons (Tukey test) to cells transfected with scramble plasmids (* p < 0.05).

