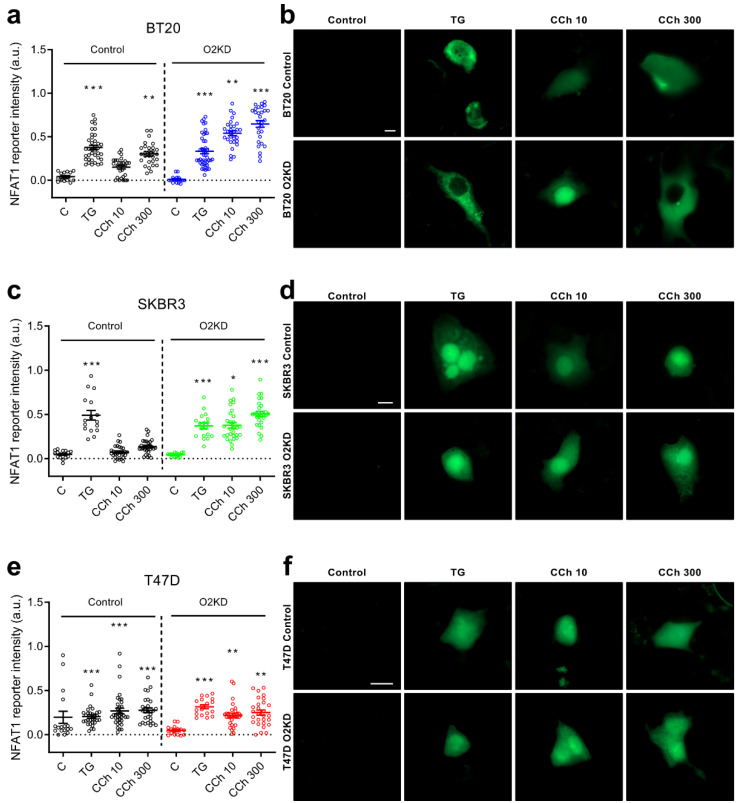
Figure 4.
Orai2 knockdown modifies NFAT1 transcriptional activity. BT20 (a,b), SKBR3 (c,d) and T47D (e,f) cells were transfected with esiOrai2 (O2KD) or non-specific siRNA (Control), as indicated, as well as with GFP-NFAT1-reporter. Cells were stimulated with 1 µM TG or CCh (10 or 300 µM). NFAT1 reporter was determined before (Control) and 120 min after the addition of TG or CCh and fluorescence was detected using confocal microscopy, as described in Section 4. Scatter plots are represented as mean ± SEM (n = 15–43; n-values correspond to individual cells). Data were statistically analyzed using Kruskal–Wallis test with multiple comparisons (Dunn´s test) to cells transfected with scramble plasmids (* p < 0.05, ** p < 0.01 and *** p < 0.001). (b,d,f) Representative images of GFP-NFAT1-reporter in BT-20, SKBR3 and T47D cells before (Control) and 120 min after the addition of TG (1 µM) or CCh (10 or 300 µM). Scale bar: 10 µm.

