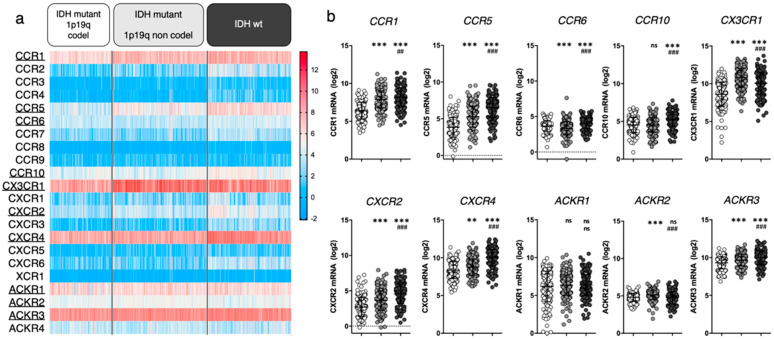
Figure 1.
Chemokine receptor expression in glioma patients (TCGA LGG-GBM dataset [25], GlioVis platform25). (a) Heatmap displaying log2 RSEM value for the 22 receptors of interest. Each cell represents one patient. The receptors that will be highlighted in this review are underlined. (b) For every receptor, log2 RSEM values were grouped into 3 categories (based on glioma genomic features). Each dot represents one patient. Data are downloaded from http://gliovis.bioinfo.cnio.es (accessed on 23 November 2021), data are represented as Mean ± SD, and analyzed via one-way ANOVA (vs. “IDHmut 1p19q codel”: ** p < 0.01; *** p < 0.001 and vs. “IDHmut 1p19q non codel”: ## p < 0.01; ### p < 0.001).

