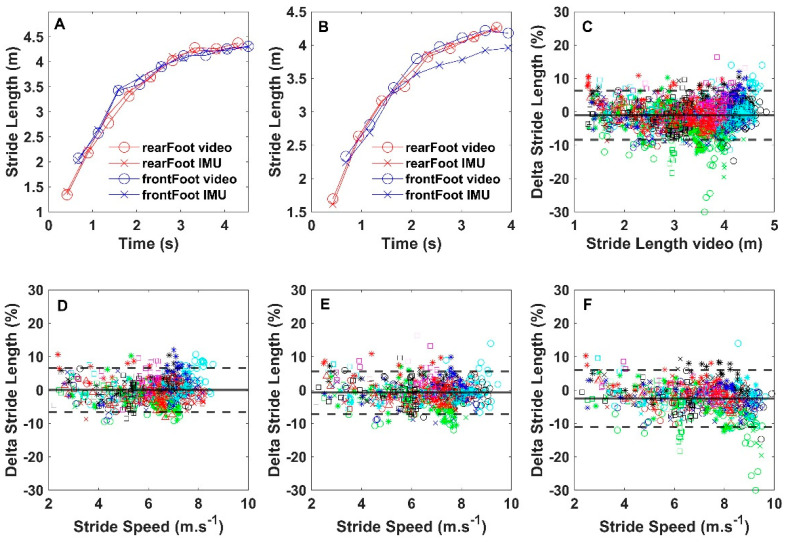
Figure 3.
Typical examples of SL of both feet (rear foot at the start in red, front foot in blue) as a function of time for participant nos. 3 (A) and no. 9 (B) at 100% effort reaching maximal speeds of 9.17 and 8.95 m·s−1, respectively. Note that SLs from video (open circles) and IMUs (crosses) are very similar for both feet in (A), while in the other participant, the IMUs underestimated SL compared to the reference for the front foot only (B). (C) depicts the delta values (IMU–video) expressed as a percentage of video SL for all strides as a function of the video reference. Each symbol represents the data of a single participant. Delta values from sprints executed at 60, 80, and 100% effort, respectively, are shown (D–F) as a function of stride speed. Note that already at 60% effort, most strides were executed at a speed >5 m·s−1. The continuous lines represent the biases and the dashed lines, the limits of agreement.

