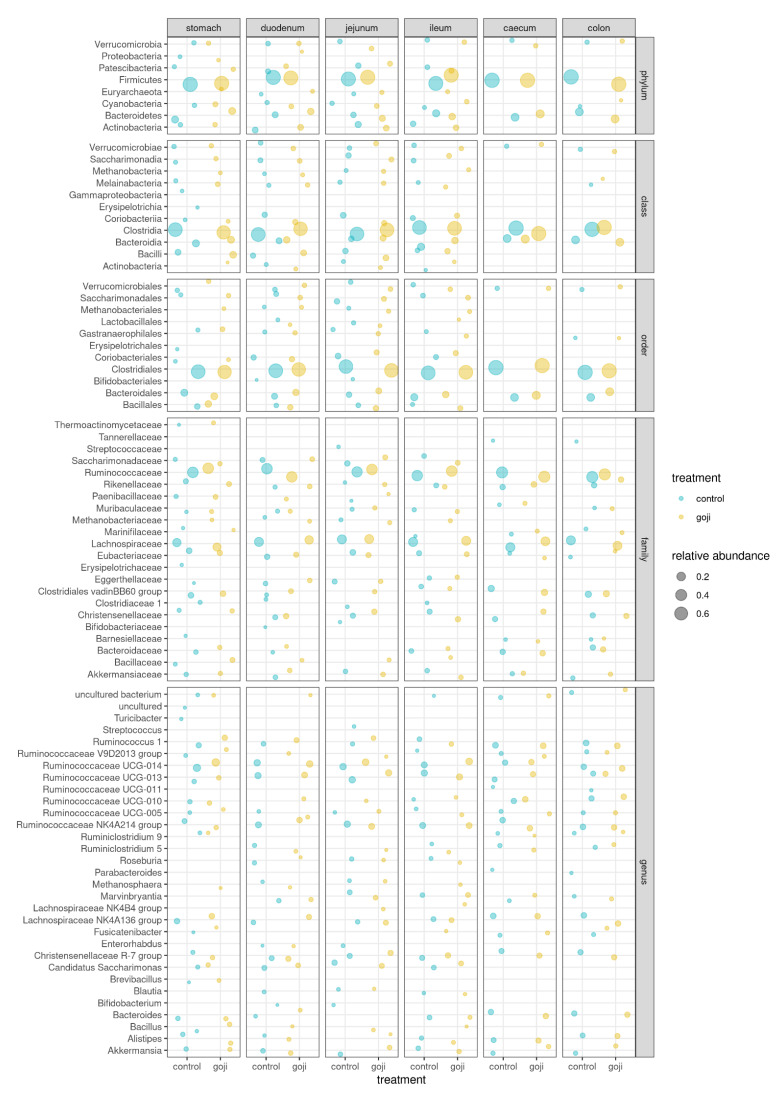
Figure 2.
Bubble chart of relative abundances of all taxa (≥1%) in the microbiota of the digestive tract of rabbits, grouped by taxonomic level. Control (blue = 14 rabbits) and Goji (yellow = 13 rabbits) experimental groups. The size of the bubble is proportional to the relative abundance, with 0.2, 0.4 and 0.6 hallmarks, as shown in the legend.

