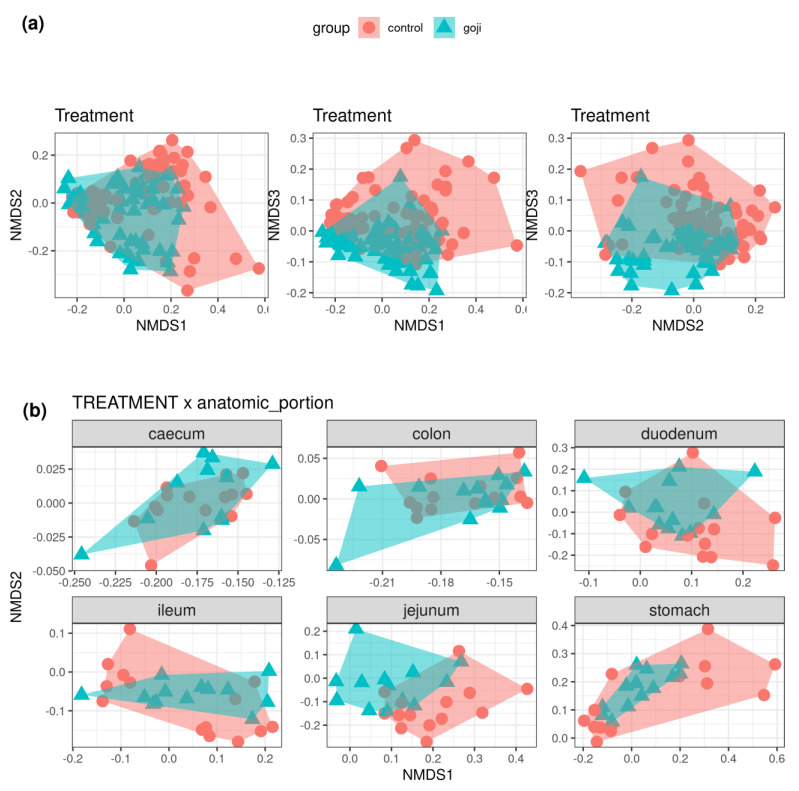
Figure 6.
(a): Non-metric multidimensional scaling plot of Bray-Curtis dissimilarities estimated from the OTU table. The plots show the first three NMDS dimensions (from left to right: dimensions one and two, one and three, two and three). Control samples in red circles, Goji-treated samples in blue triangles. (b): First two dimensions from the non-metric dimensional scaling of Bray-Curtis dissimilarities between control and Goji-treated samples along the digestive tract of rabbits. For the analyses, 14 and 11–13 samples were used for the control and Goji groups, respectively.

