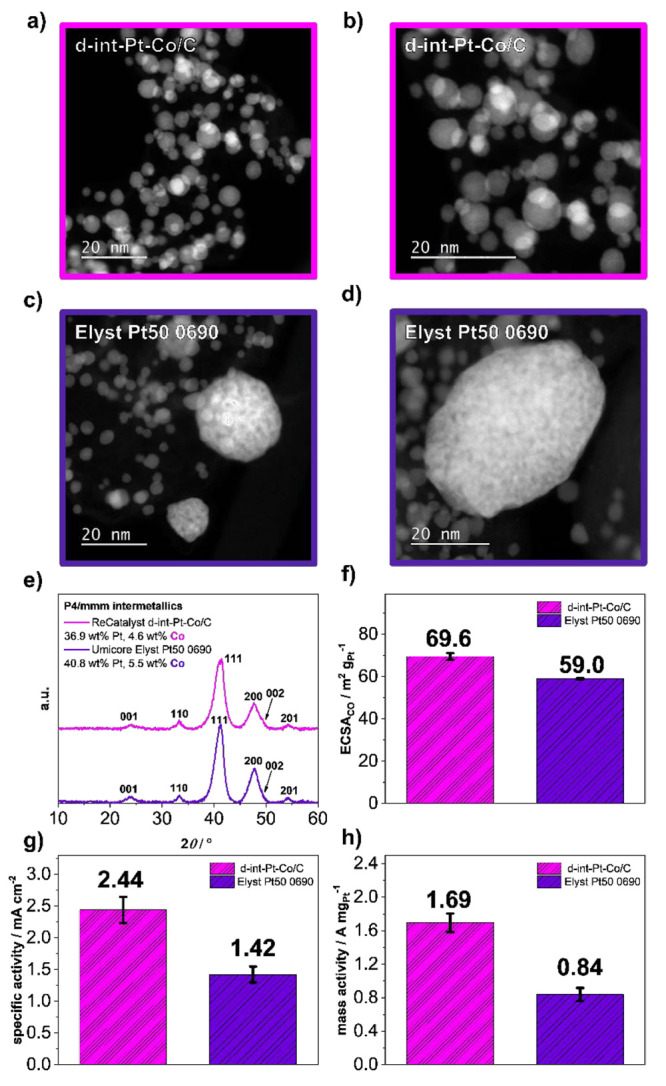
Figure 1.

(a–d) HAADF TEM, (e) XRD, and (f–h) TF-RDE comparison between ReCatalyst d-int–Pt-Co/C electrocatalyst and Umicore Elyst Pt50 0690 Pt-Co/C benchmark. Additional characterization is available in the SI, Figures S3–S5. In all figures, magenta is used for the data corresponding to the experimental ReCatalyst electrocatalyst, whereas the data corresponding to the Umicore benchmark is in purple.
