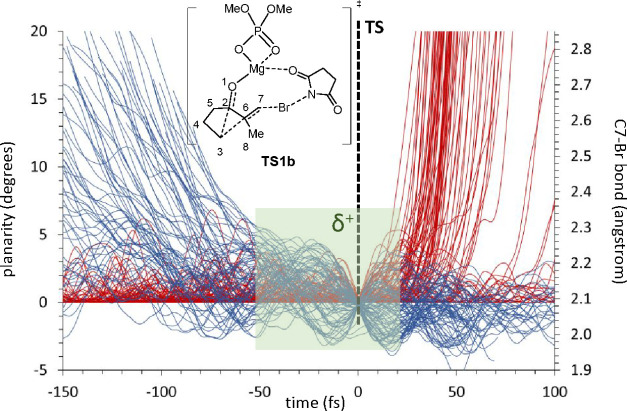
Figure 4.
Representation of the C7–Br distance (blue lines) and planarity of C6 {red lines; as 360 – [<(2,6,7) + <(7,6,8) + <(8,6,2)]} for 130 trajectories starting from TS1b. The green area indicates, approximately, the minimum time in which only C6 is a sp2 carbon, thus corresponding to a carbocation.

