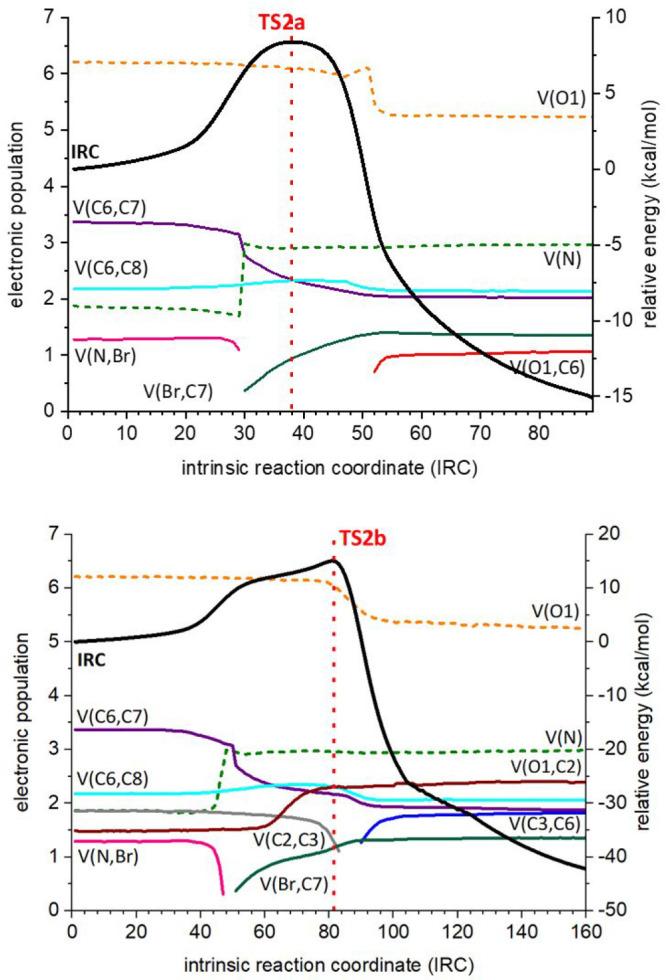
Figure 7.

ELF analyses for the reaction of EC2 (R = Ph) through TS2a (top) and TS2b (bottom) to give epoxide EP2 and (2S,4S)-CY2, respectively. The numbering refers to that given in Figure 5. Black traces correspond to IRC. Colored dotted traces refer to lone pairs (monosynaptic basins), and colored plain traces to bonds (disynaptic basins). The vertical red line indicates the transition state. Only those representative atoms and bonds are shown (for the full set of data, see the Supporting Information).
