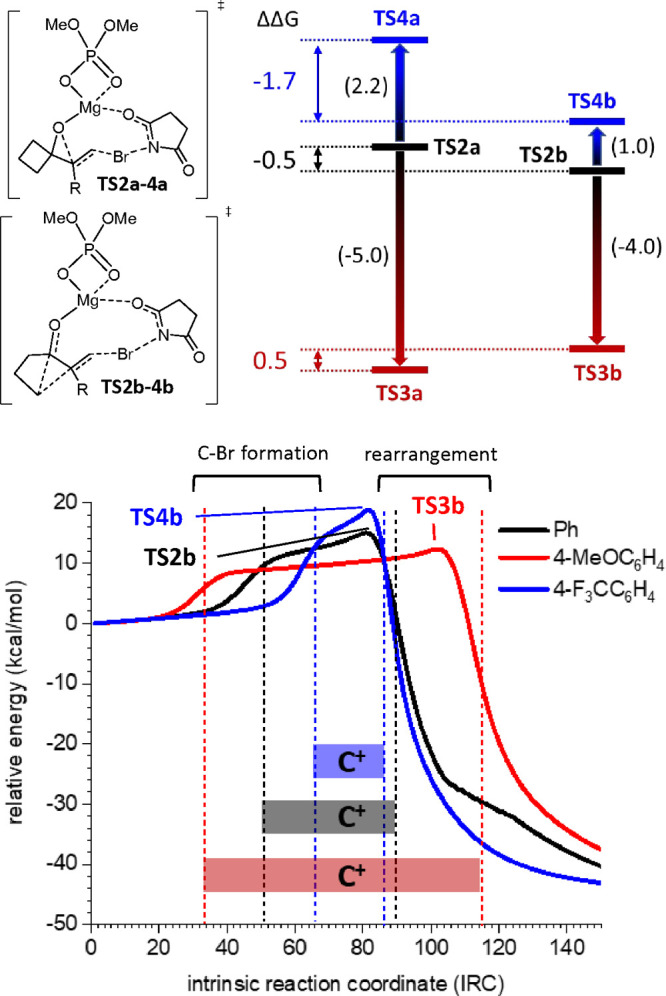
Figure 8.

(De)stabilization of TS2a (left) and TS2b (right) (black traces) upon introduction of MeO (TS3a and T3b; red traces) and CF3 (TS4a and T4b; blue traces) groups at the para position in the aromatic ring linked to the double bond (top). Numbers in brackets indicate the gap (ΔΔG in kilocalories per mole) between the different energy barriers for R = Ph (black), 4-MeOC6H4 (red), and 4-F3CC6H4 (blue). Colored numbers indicate the relative energies (ΔΔG in kilocalories per mole) between the two series a and b leading to epoxide and cyclopentanone, respectively. IRCs for TS2b (black trace), TS3b (red trace), and TS4b (blue trace) (bottom). The first dashed line indicates the formation of the C7–Br bond; the second one indicates the rearrangement [according to ELF analyses (see the Supporting Information)]. The corresponding intervals, represented as horizontal bands, indicate the extension of the transient carbocation during the intrinsic reaction coordinate. The superposition of IRCs has been done from the starting point at which the N–Br bond completely formed.
