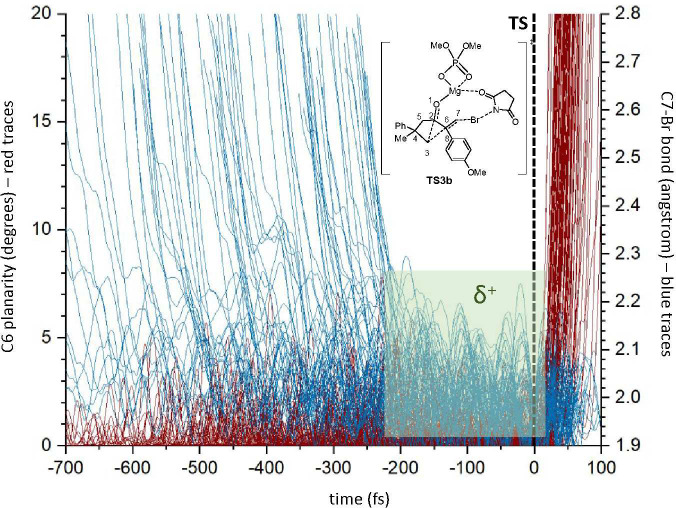
Figure 9.
Representation of the C7–Br distance (blue traces) and C6 planarity {red lines; defined in degrees as 360 – [<(2,6,7) + <(7,6,8) + <(8,6,2)]} for 102 trajectories starting from TS3b. By comparison of the planarity of C6 (from the start of the reaction until the rearrangement) with the formation of the C7–Br bond, it is possible to estimate the time in which C6 remains planar. The green area represents the minimum time in which only C6 is planar and, consequently, a carbocationic sp2 carbon.

